27 guides
Learn to read crypto charts
Step-by-step guides to reading a crypto chart the way Chart Radars does: structure first, then levels, liquidity, derivatives and two conditional scenarios. Diagrams drawn from code, real charts from the bot, no hype.
Start here
The whole method in one guide
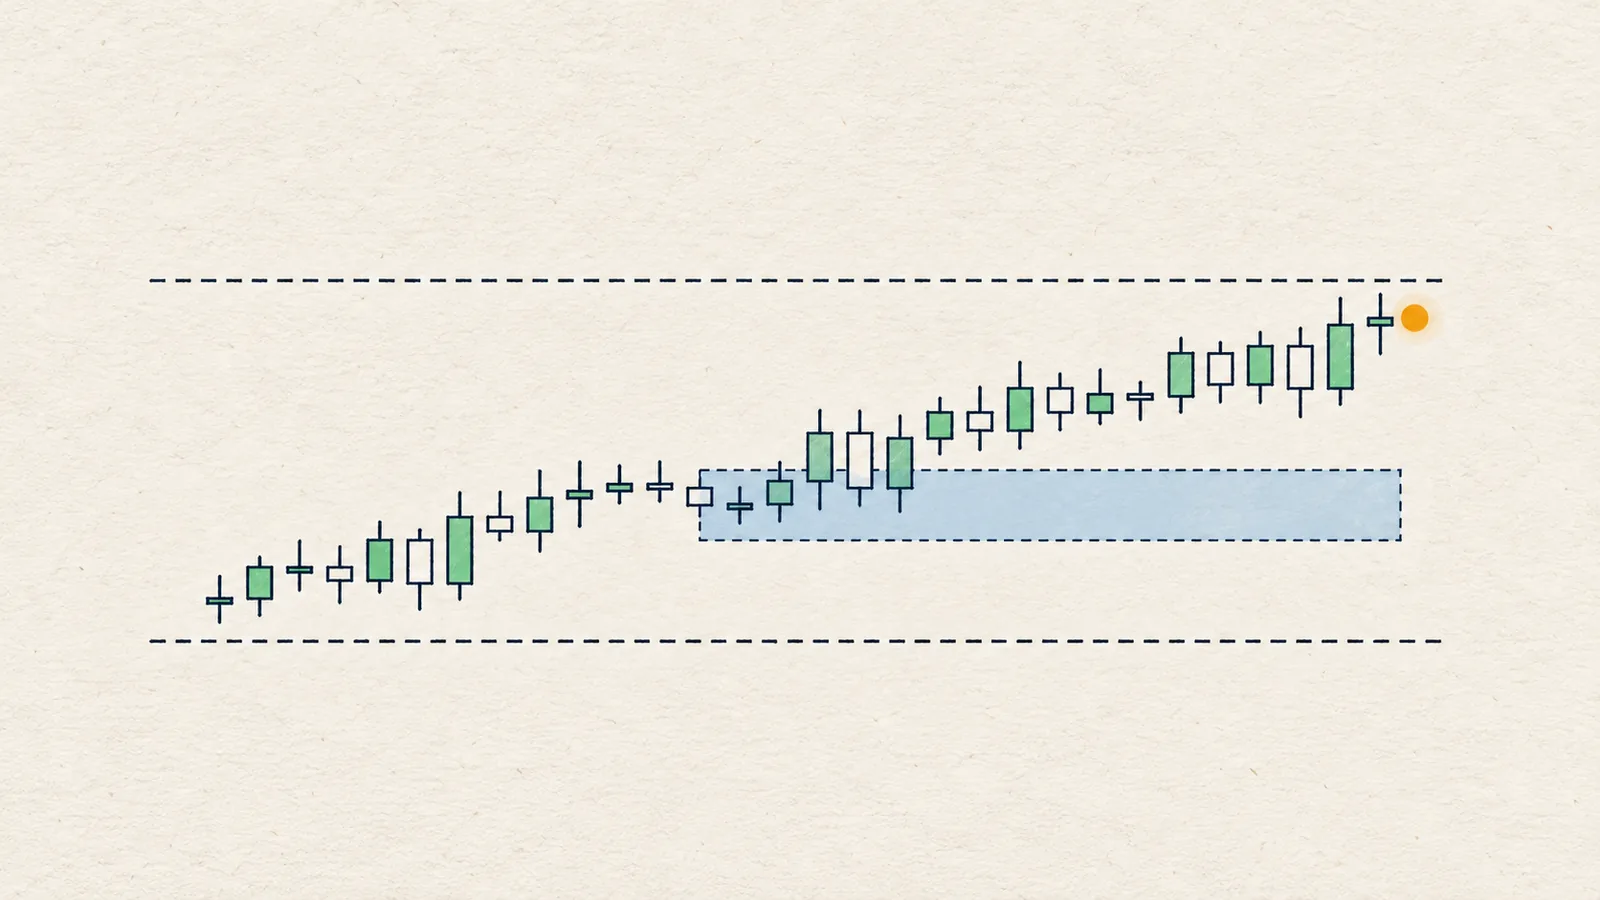 How to read a crypto chart: a step-by-step method with a real exampleA chart read is a map of conditions, not a prediction. Follow the same seven steps every time and you will always know what to wait for.
 How to read a Chart Radars read: every line and every chart marker explainedA read is a map of conditions, not a prediction. Here is what each line says, how it is computed and what each mark on the chart means.
Basics
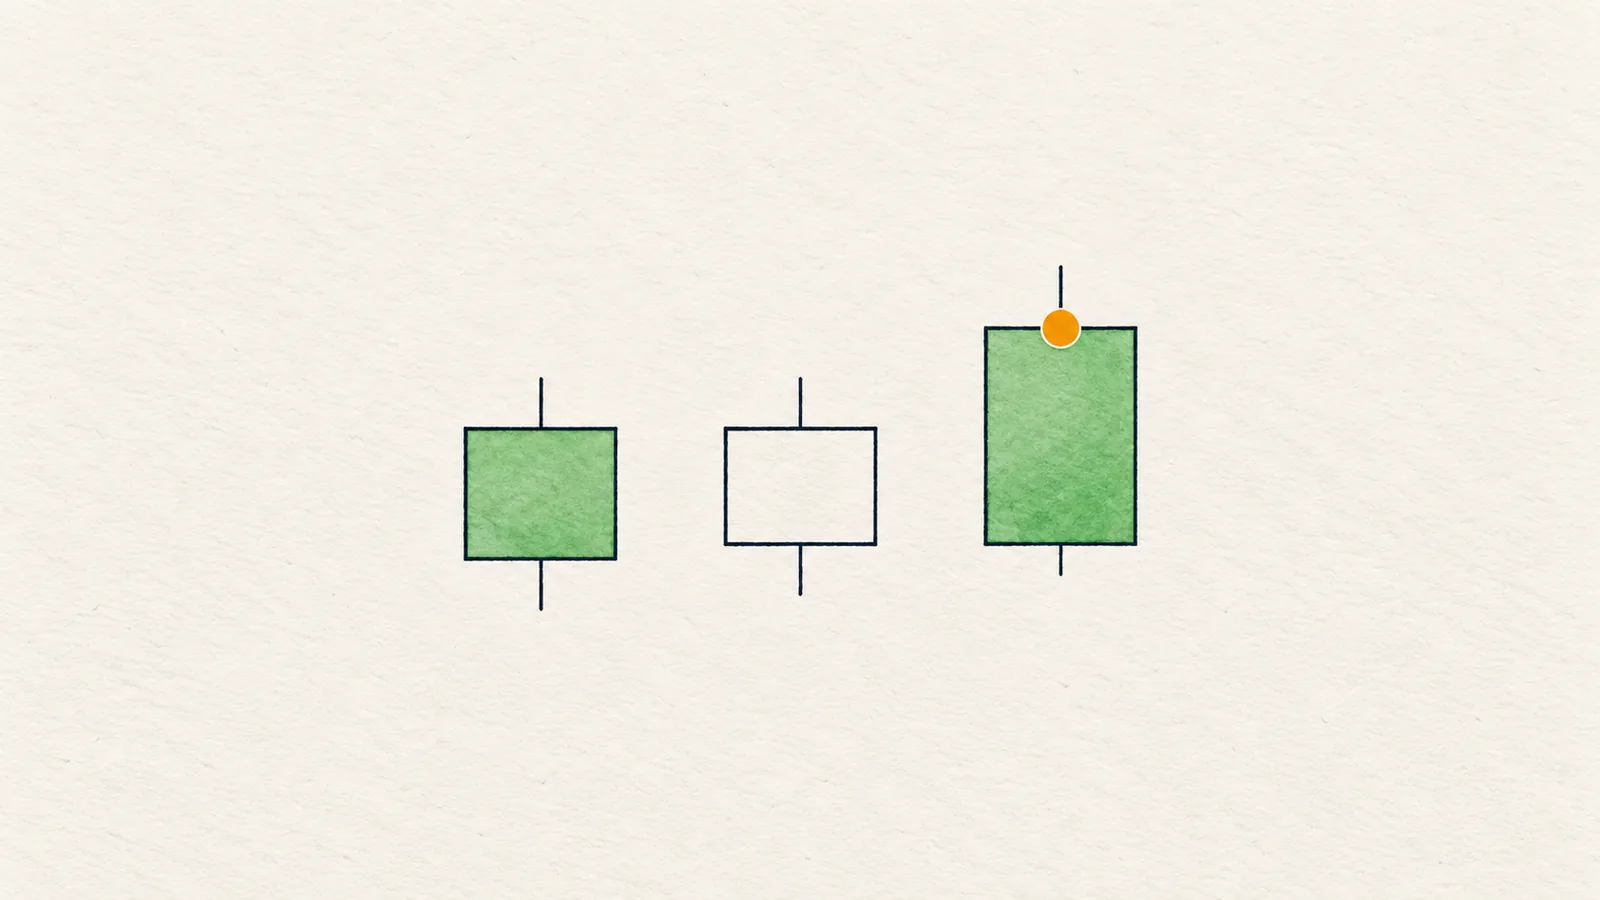
Candles and the chart itself
Structure
Trend, swings and breaks
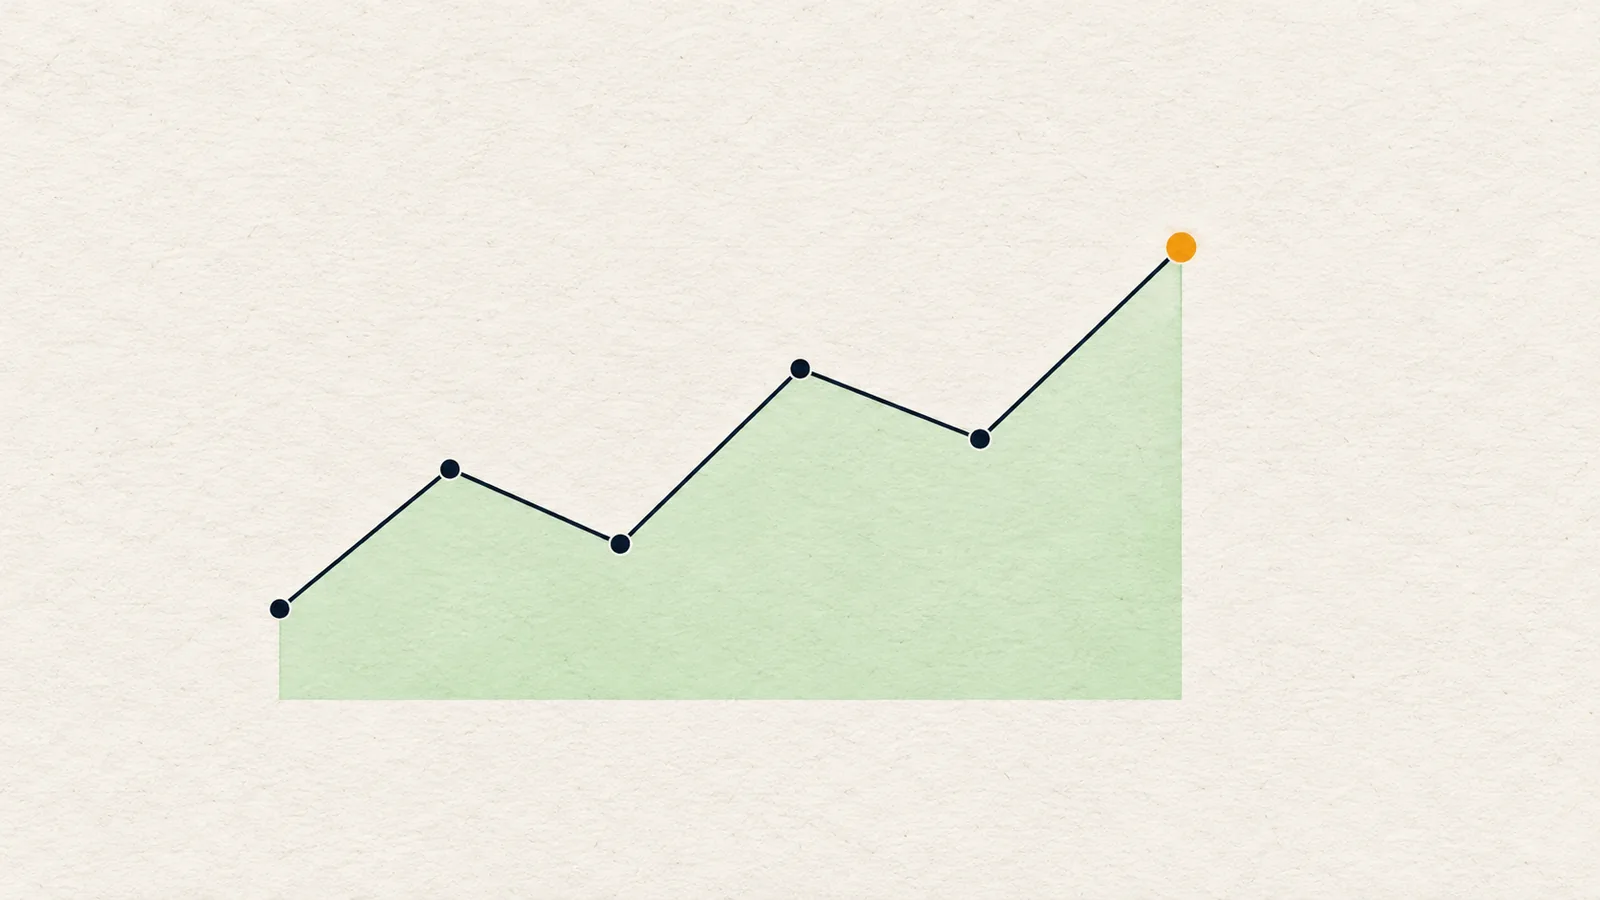 Market structure in crypto: swing points, HH/HL, LH/LL and trend vs rangeStructure is the trail of swing highs and lows price leaves behind. Read it first and every other tool on the chart gets easier to judge.
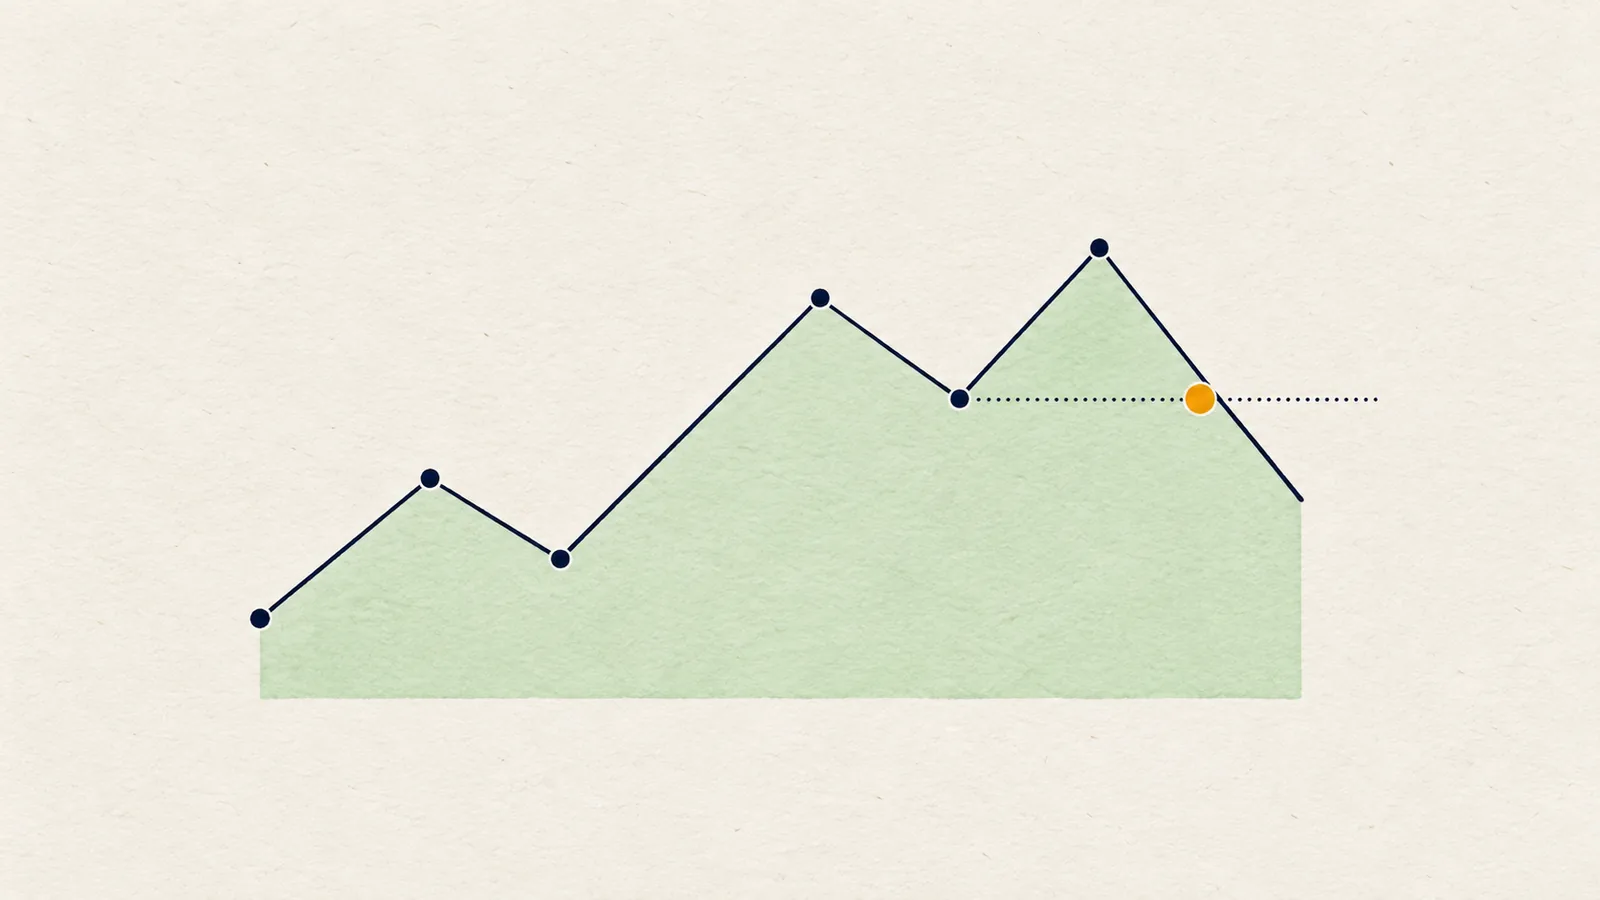 BOS vs CHoCH: break of structure and change of character explainedA BOS says the current direction is still working. A CHoCH says the first crack has appeared. Neither tells you what happens next.
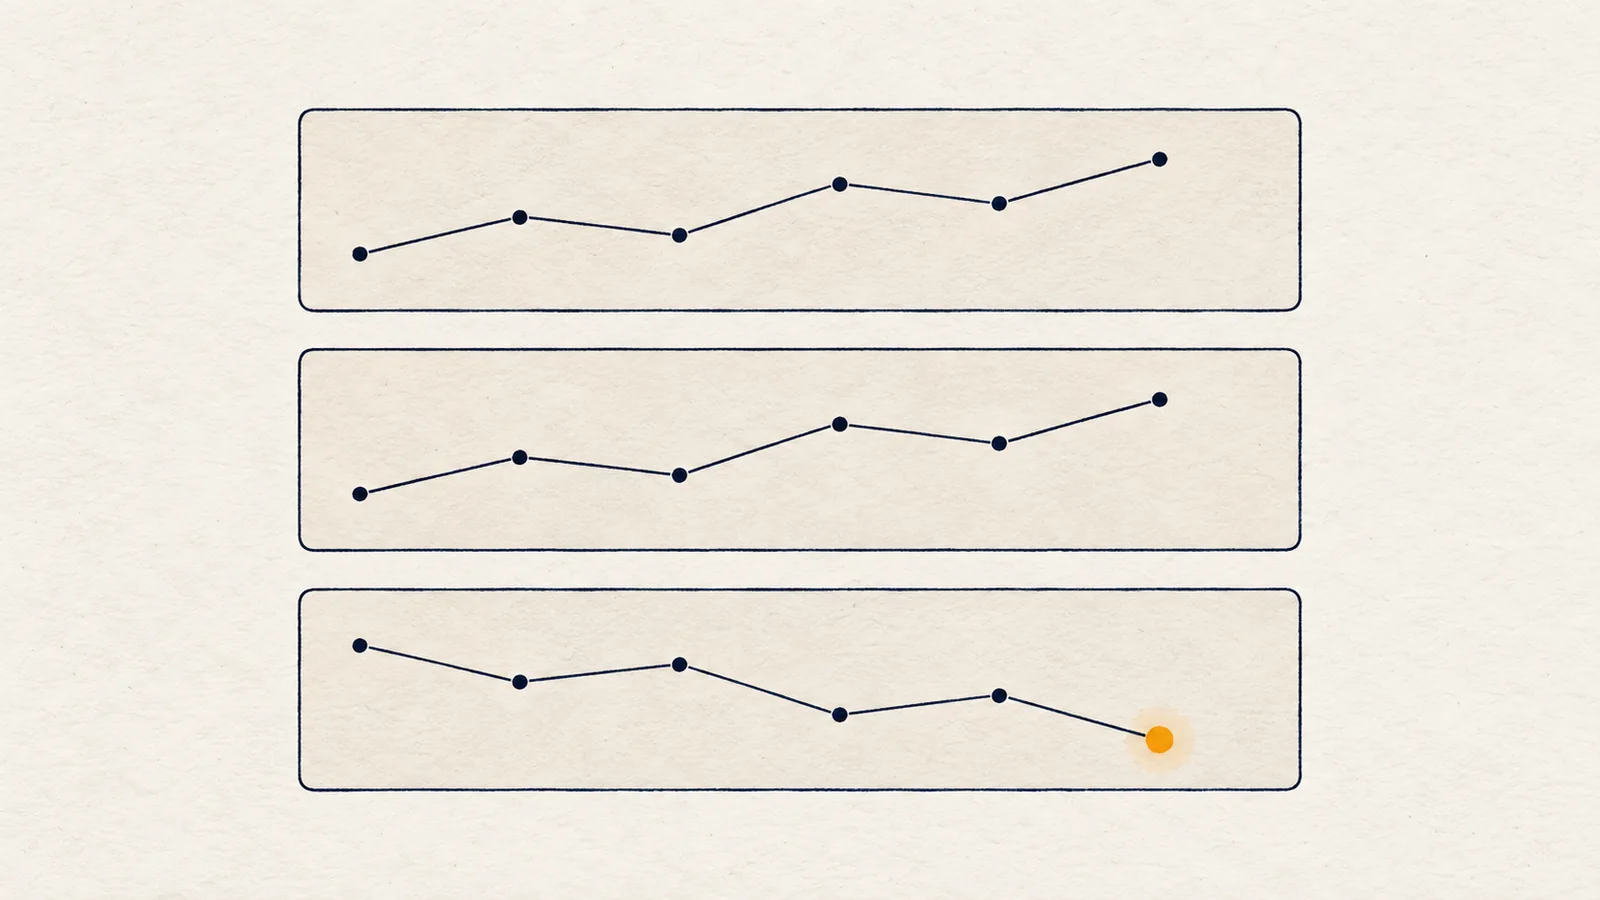 Multi timeframe analysis: how to read 1W, 1D, 4H and 1H togetherEach timeframe answers a different question. Read them top-down, and when they disagree, call it what it is: a range.
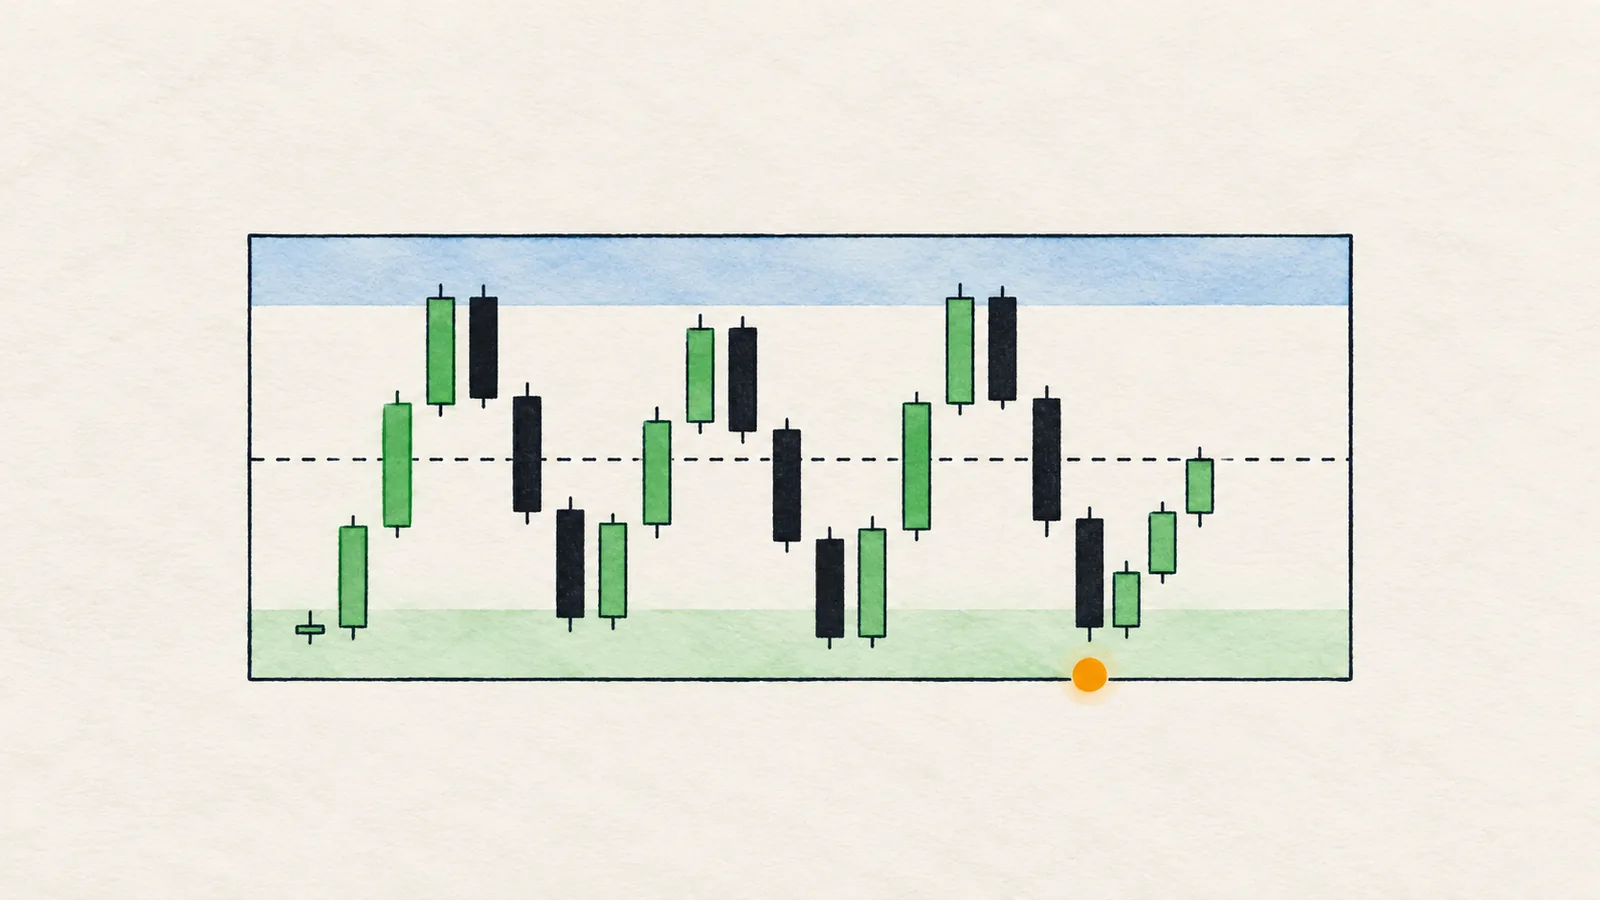 Range trading in crypto: how to read edges, the midline and the exitA range is a market that has no direction yet. The edges carry the information; the middle carries mostly noise. Here is how to tell them apart.
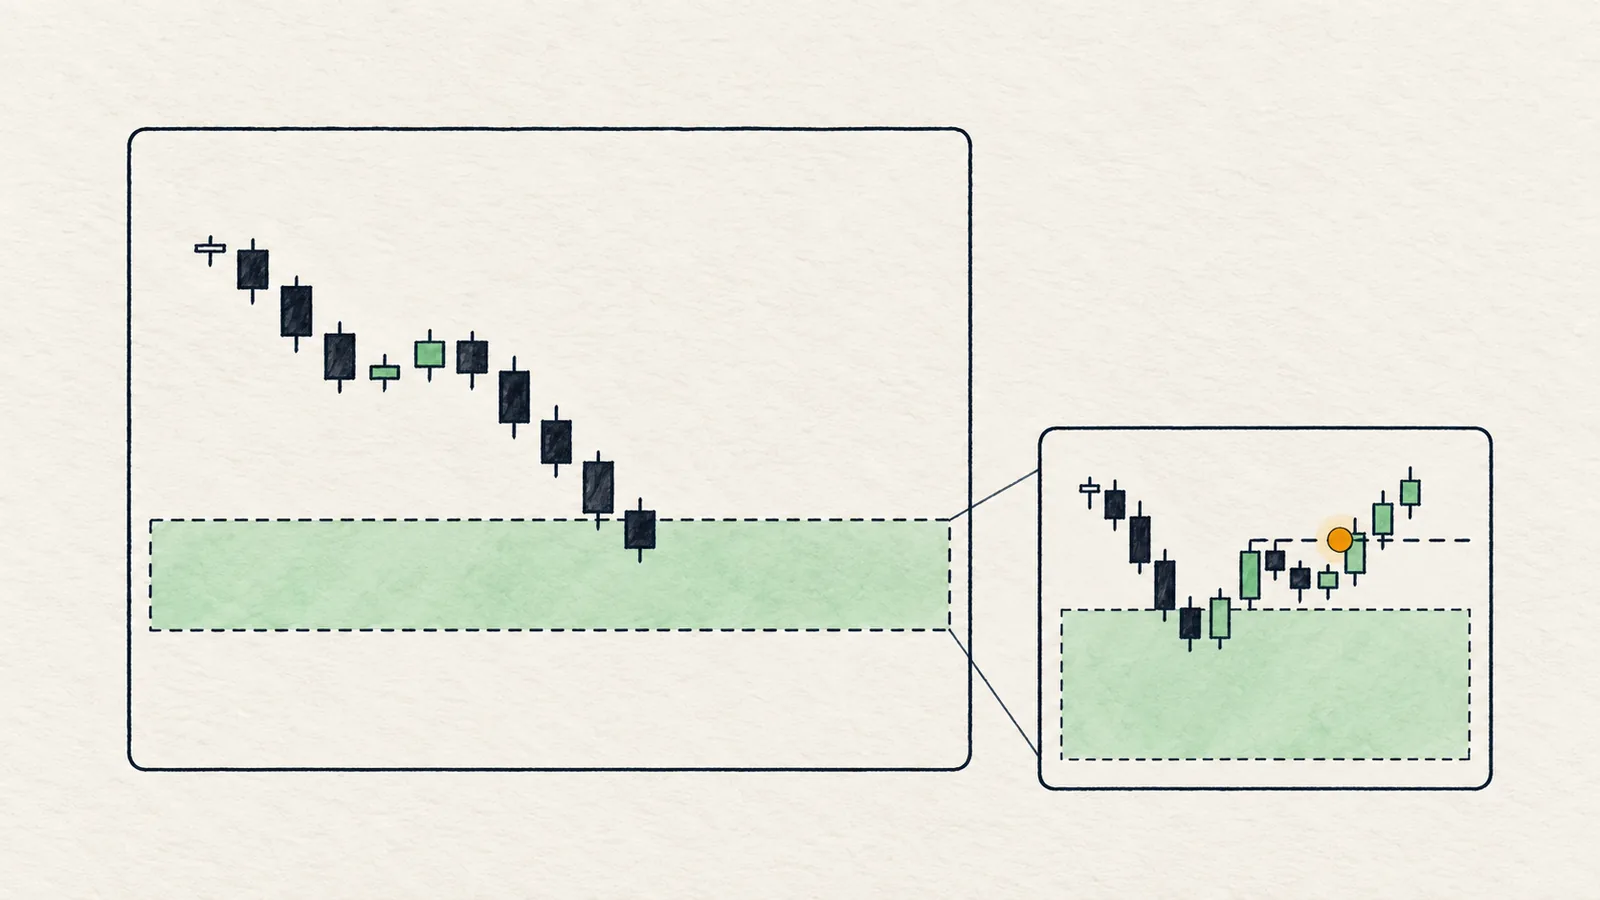 Lower timeframe confirmation: how to use a 15m structure shift inside a zoneA higher-timeframe zone tells you where to look. A structure shift on a lower timeframe tells you whether price is reacting there. Here is how to combine them.
Levels
Where price reacts
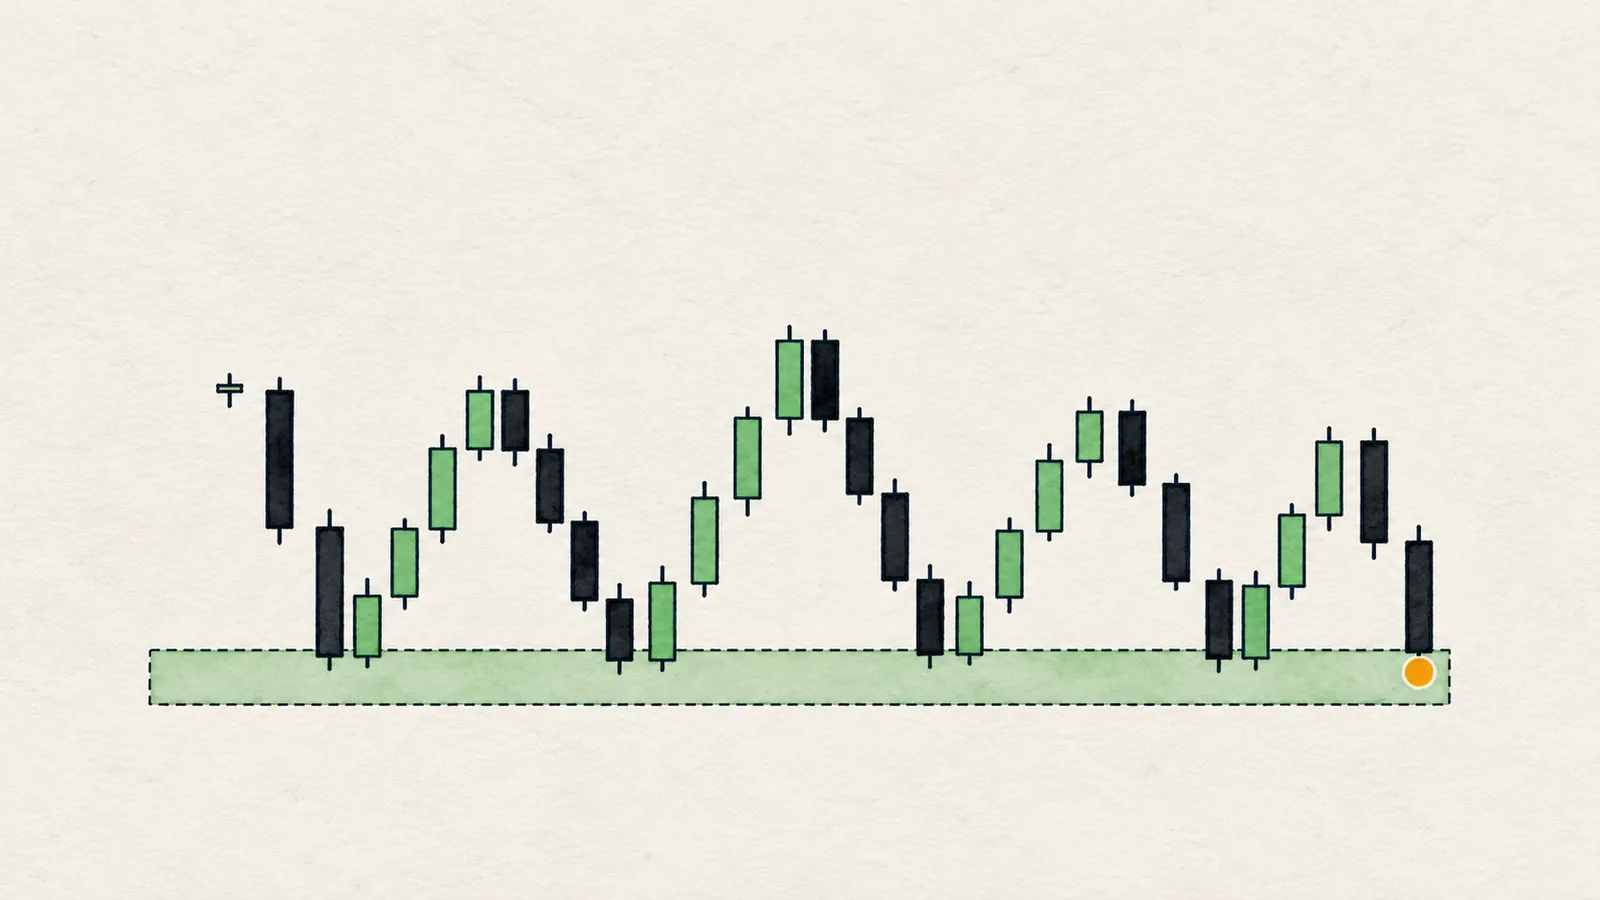 Support and resistance: how to draw levels that actually matterGood levels are zones built from clustered swing points, not single lines. Here is how to draw fewer, better ones and use them for if/then plans.
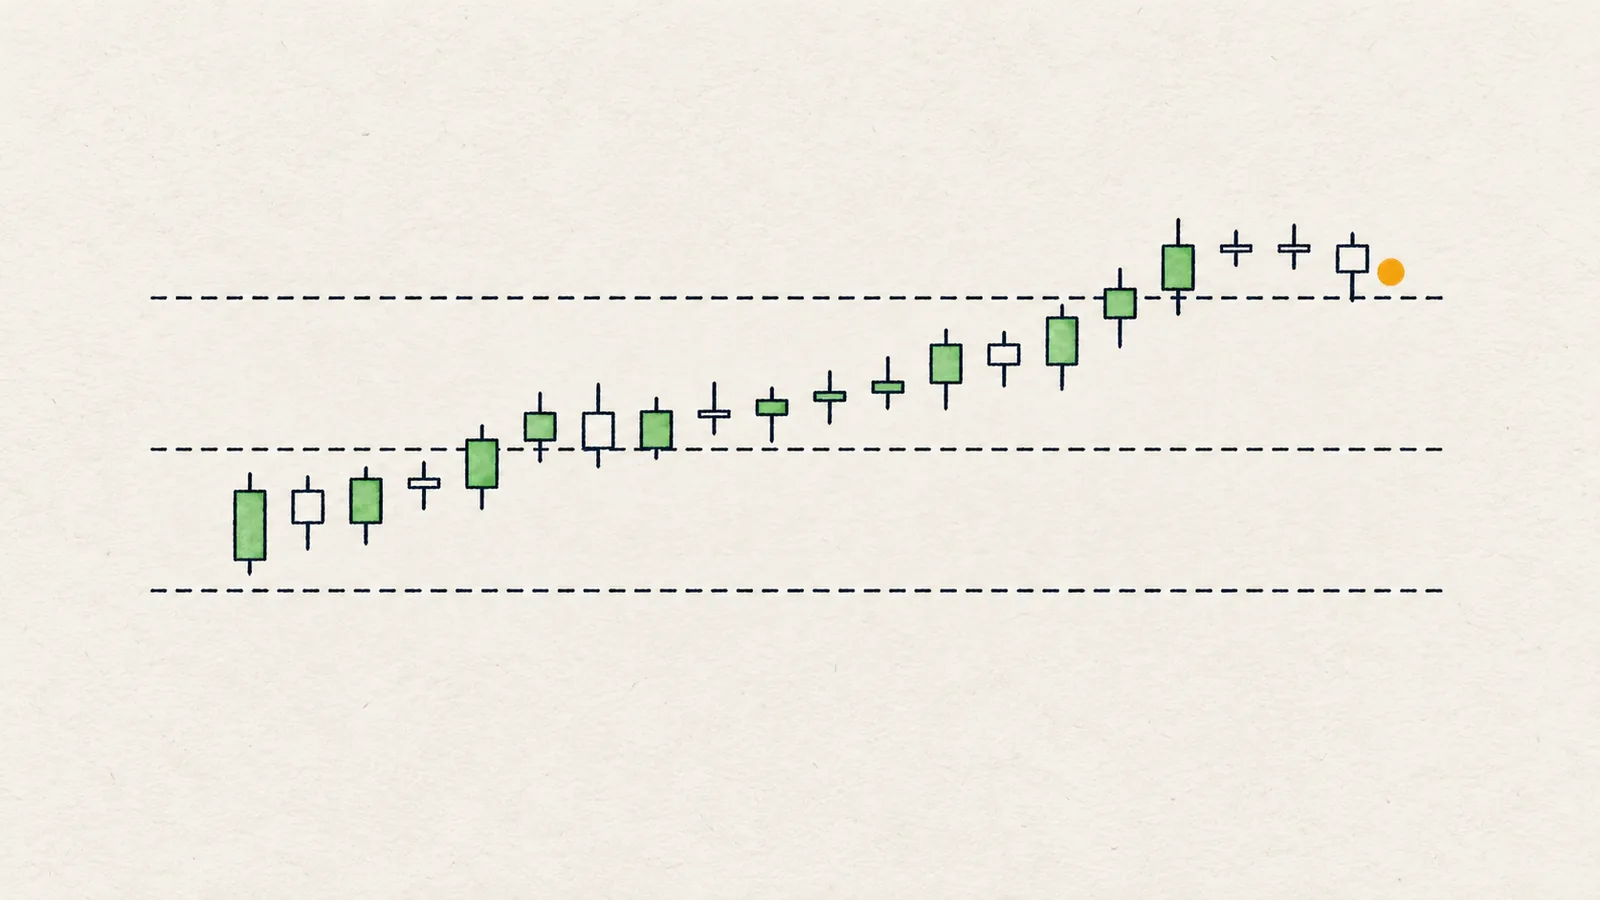 Weekly, daily and monthly open: reference levels for a 24/7 marketThe open is the first price of a new day, week or month. Price above it means buyers won the period so far; below it, sellers did.
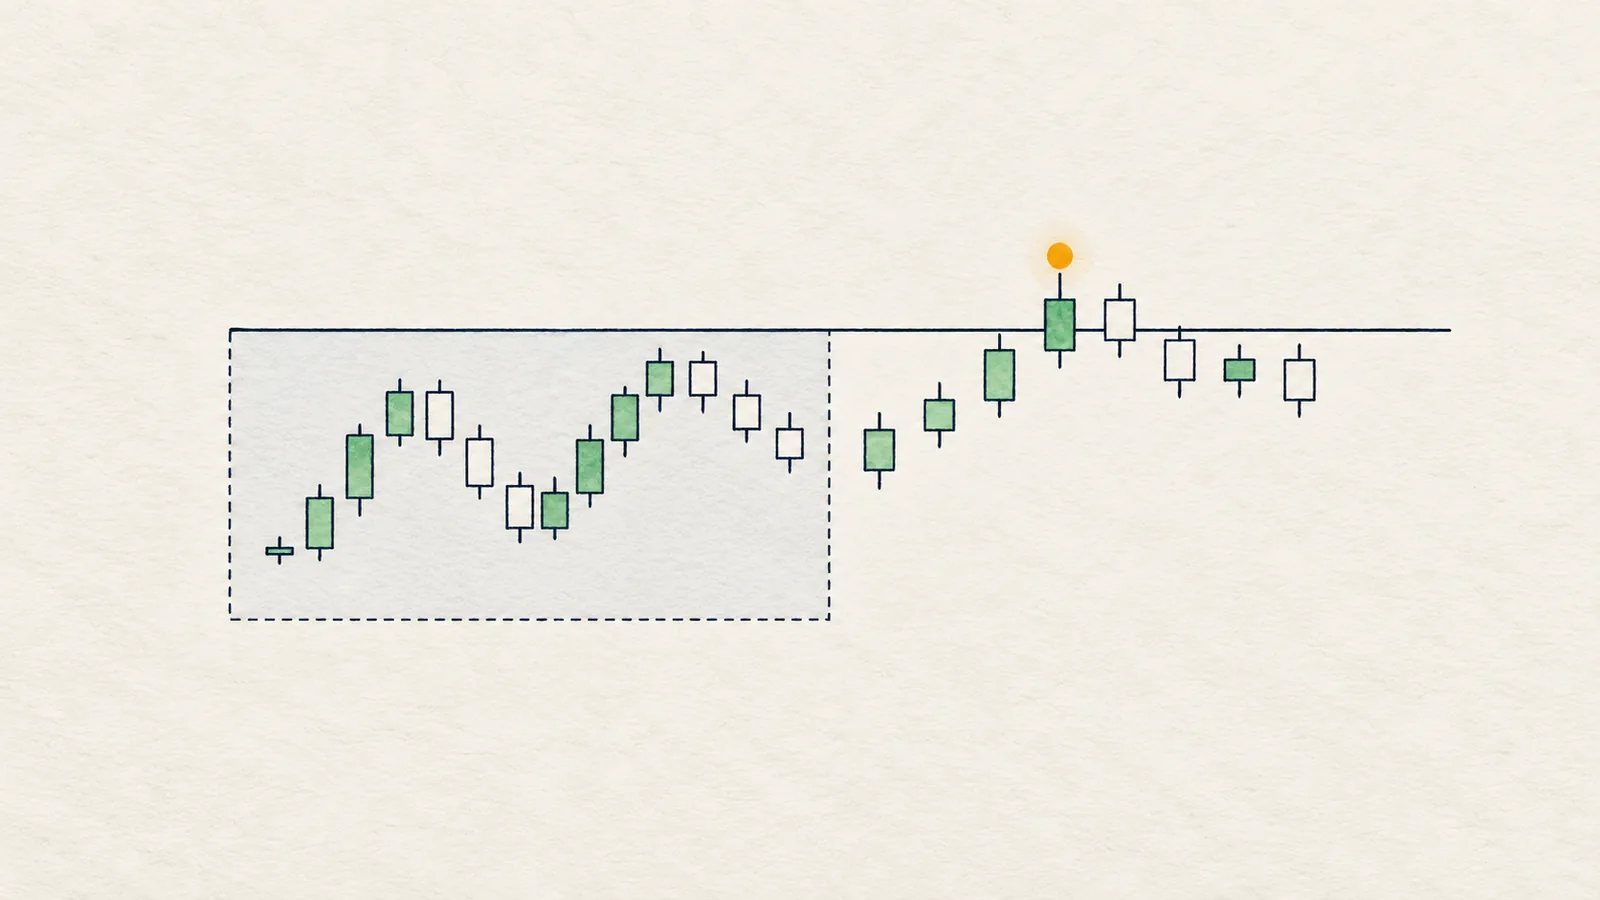 Previous day and week high and low: PDH, PDL, PWH and PWL explainedThe highest and lowest prices of the last day and week are some of the most watched levels on any chart. Here is why, and how to use them in if/then plans.
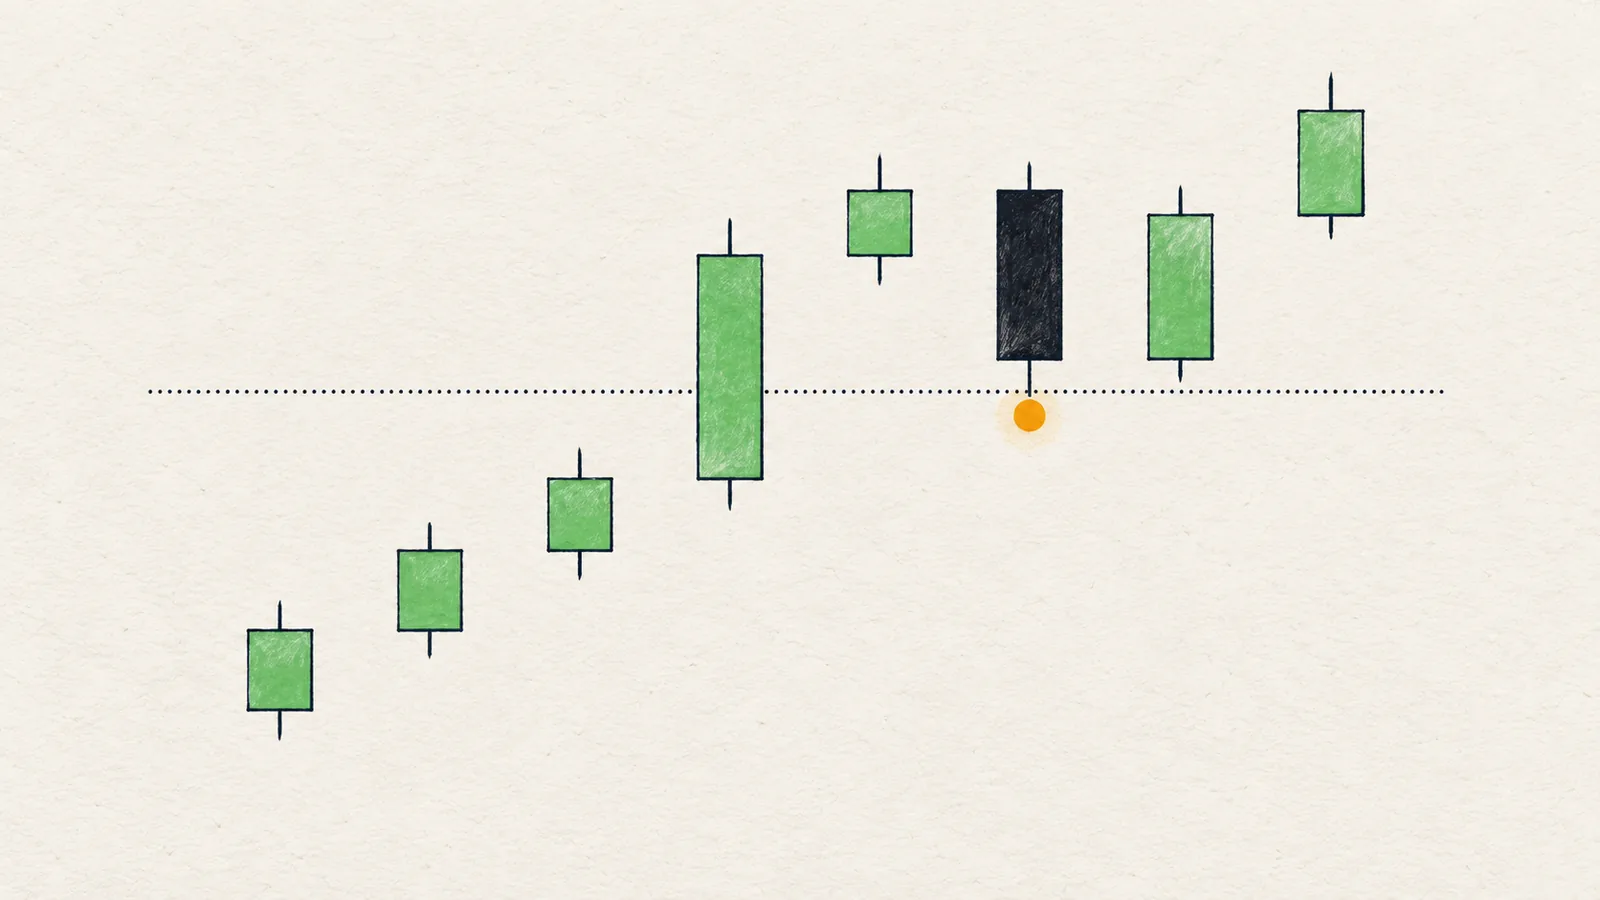 Breakout, retest and fakeout: how to tell a real break from a trapA breakout is a close beyond a level. The retest is price coming back to check it. A fakeout is a close that gets taken back. Here is how to tell them apart.
Liquidity
Where the stops rest
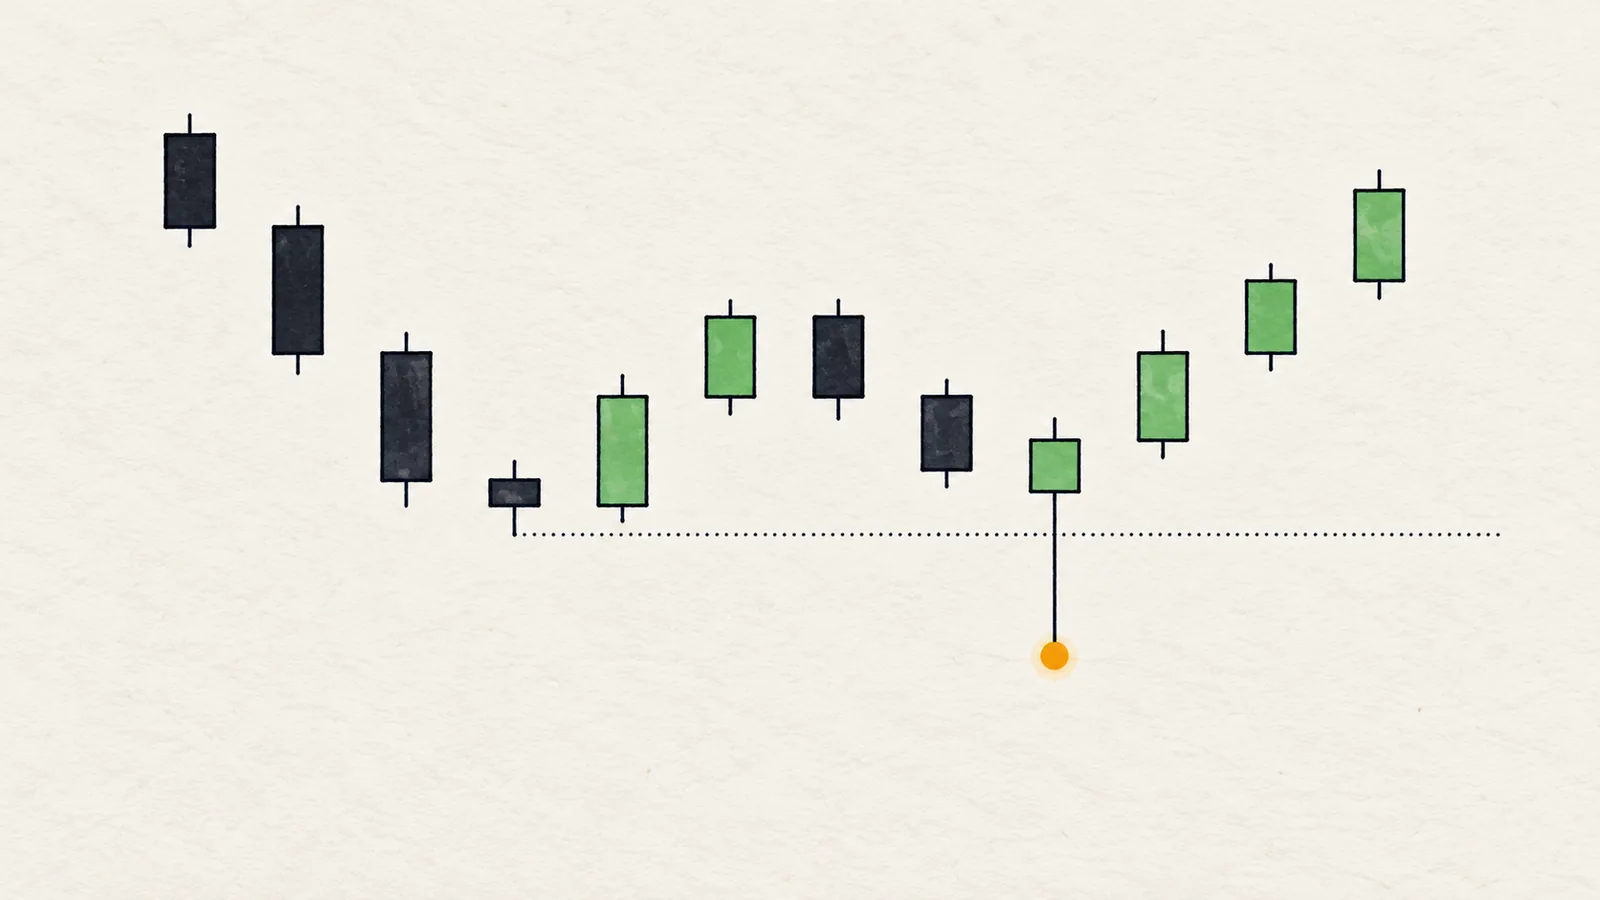 Liquidity sweep: what it is and how to read it on a crypto chartA wick takes the stops beyond a level, then price closes back inside. Here is how to read it without guessing.
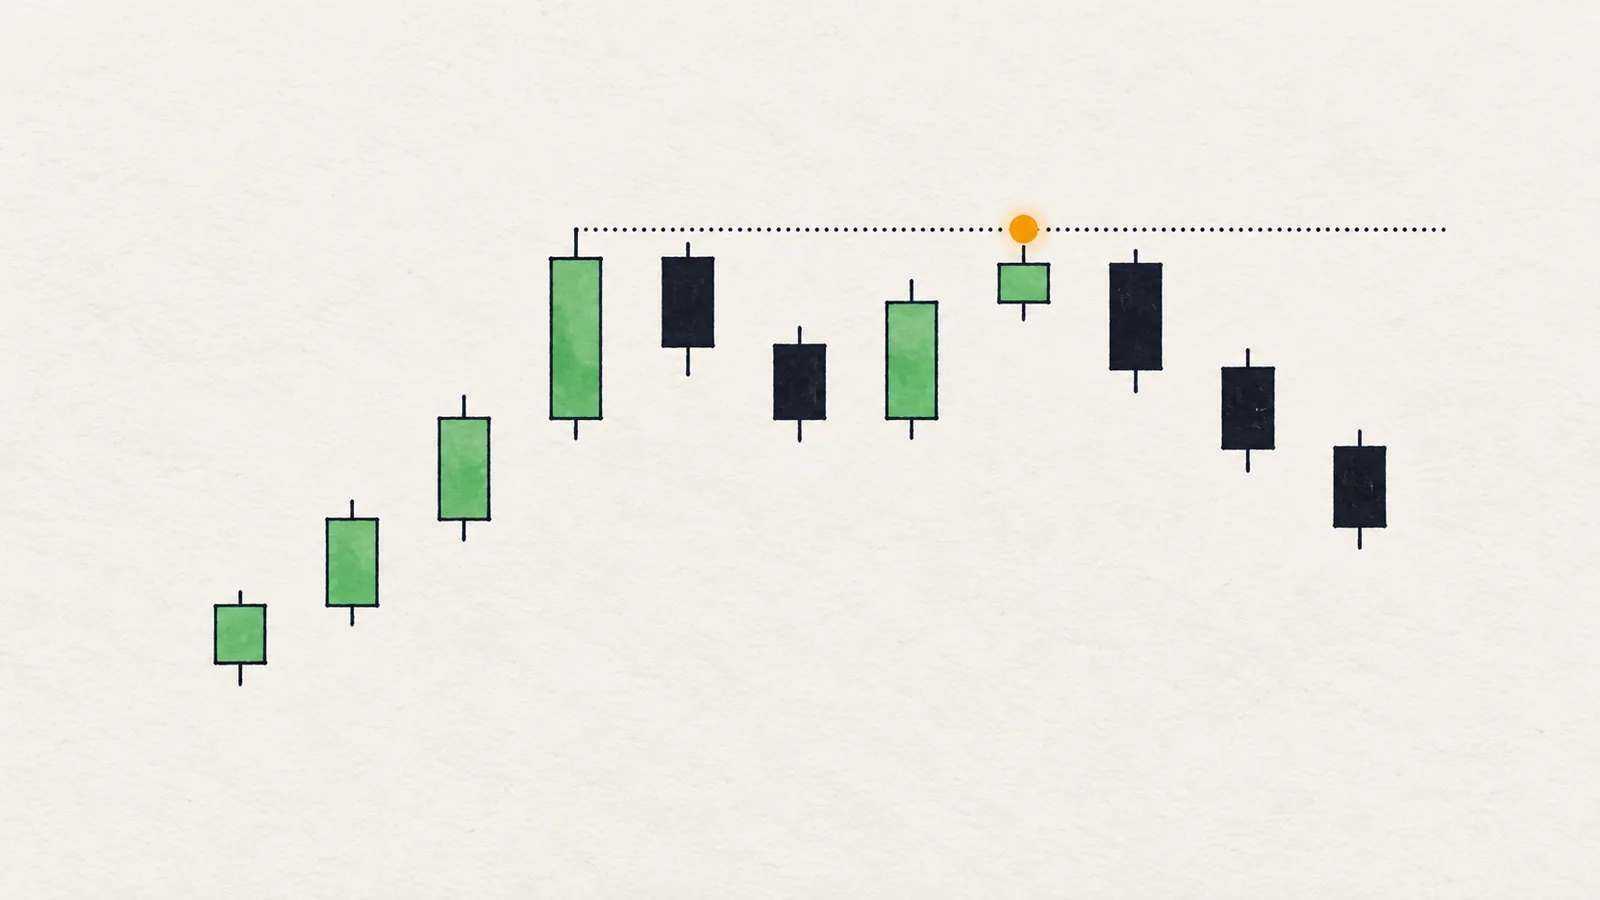 Equal highs and equal lows: how resting liquidity builds on a chartTwo tops or two bottoms at the same price look like a clean level. They are also where stop orders pile up.
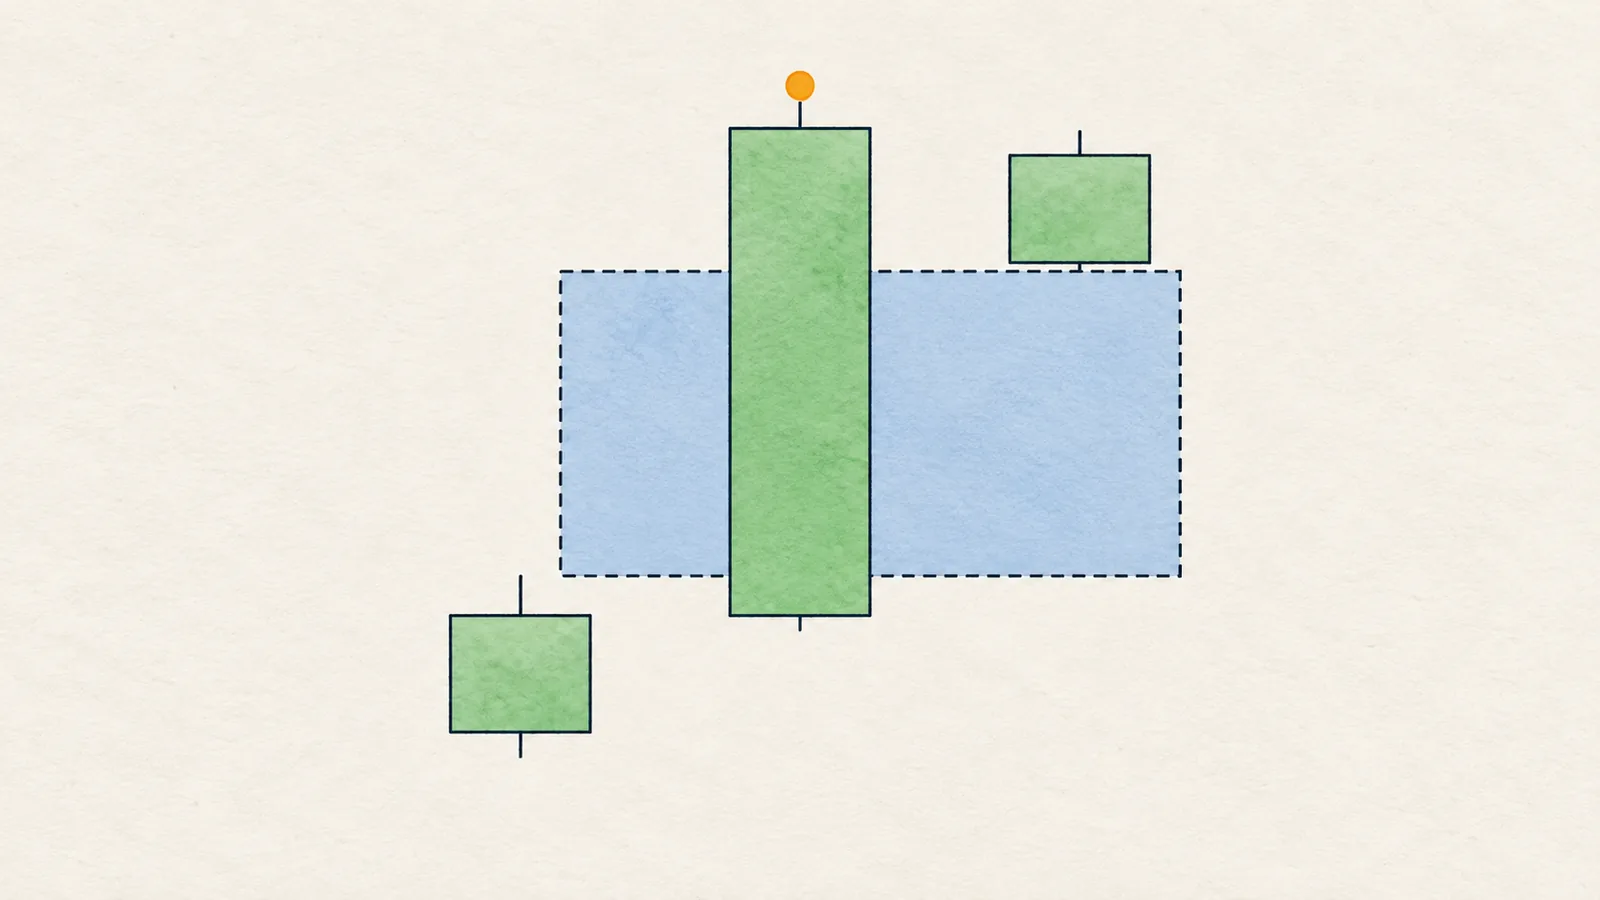 Fair value gap (FVG): how to draw it and when it mattersA fair value gap is the stretch of price a fast candle skipped over. Here is how to mark it exactly and when to ignore it.
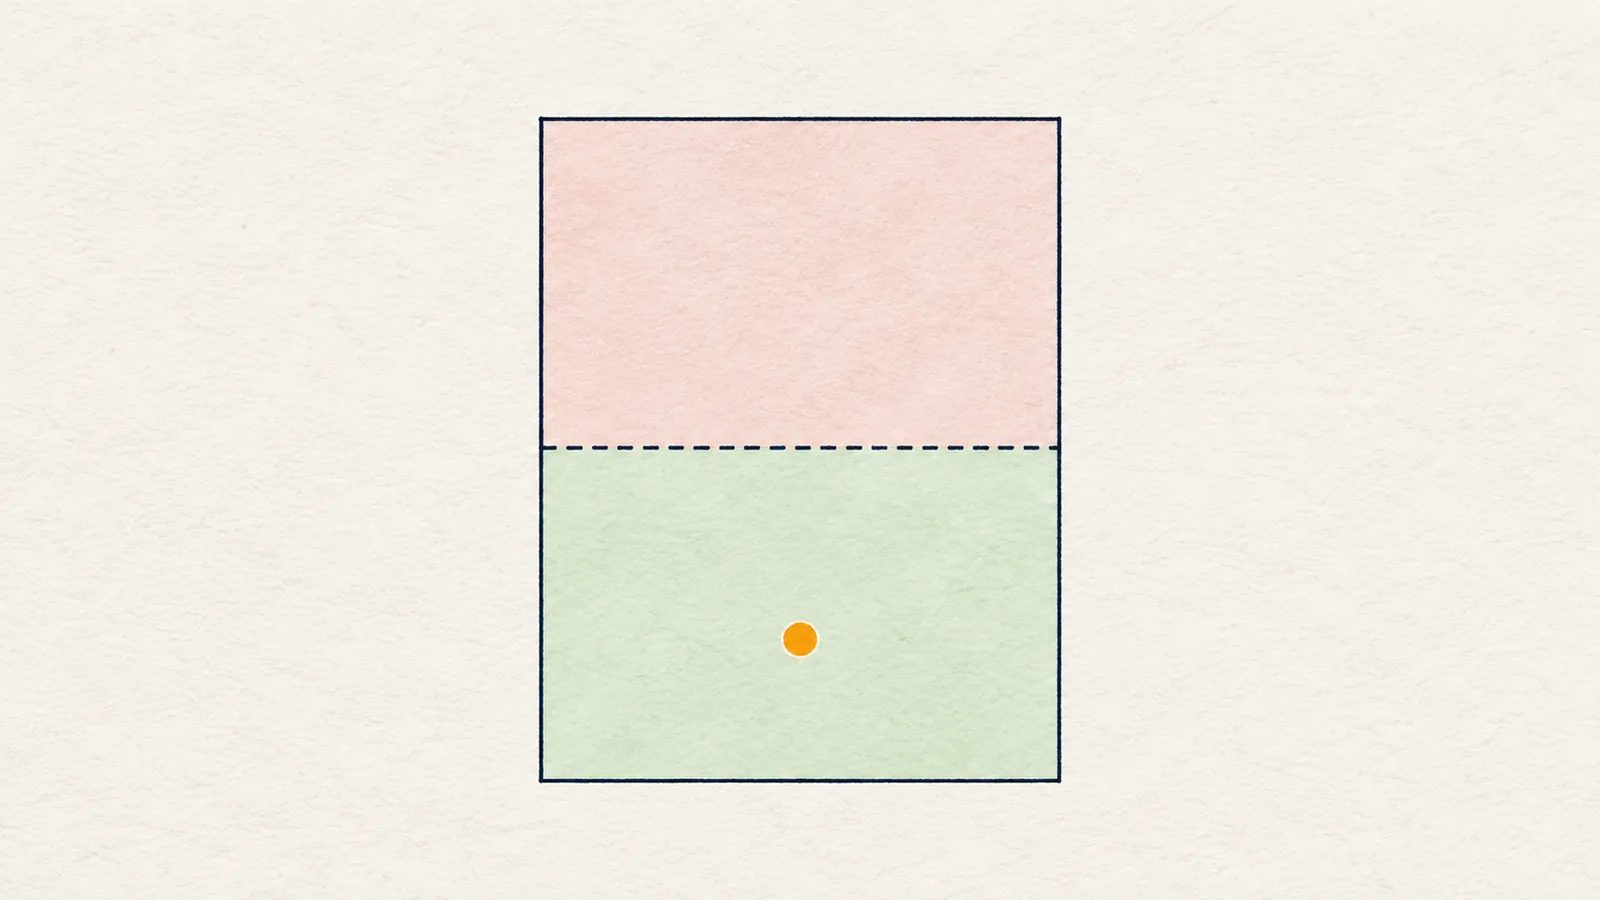 Premium and discount zones: how to tell a cheap entry from a chased oneSplit the current range at 50% and you can see whether price is paying up or getting a discount. Here is how to use that without turning it into a rule.
Indicators
ATR, EMA, volume, RSI
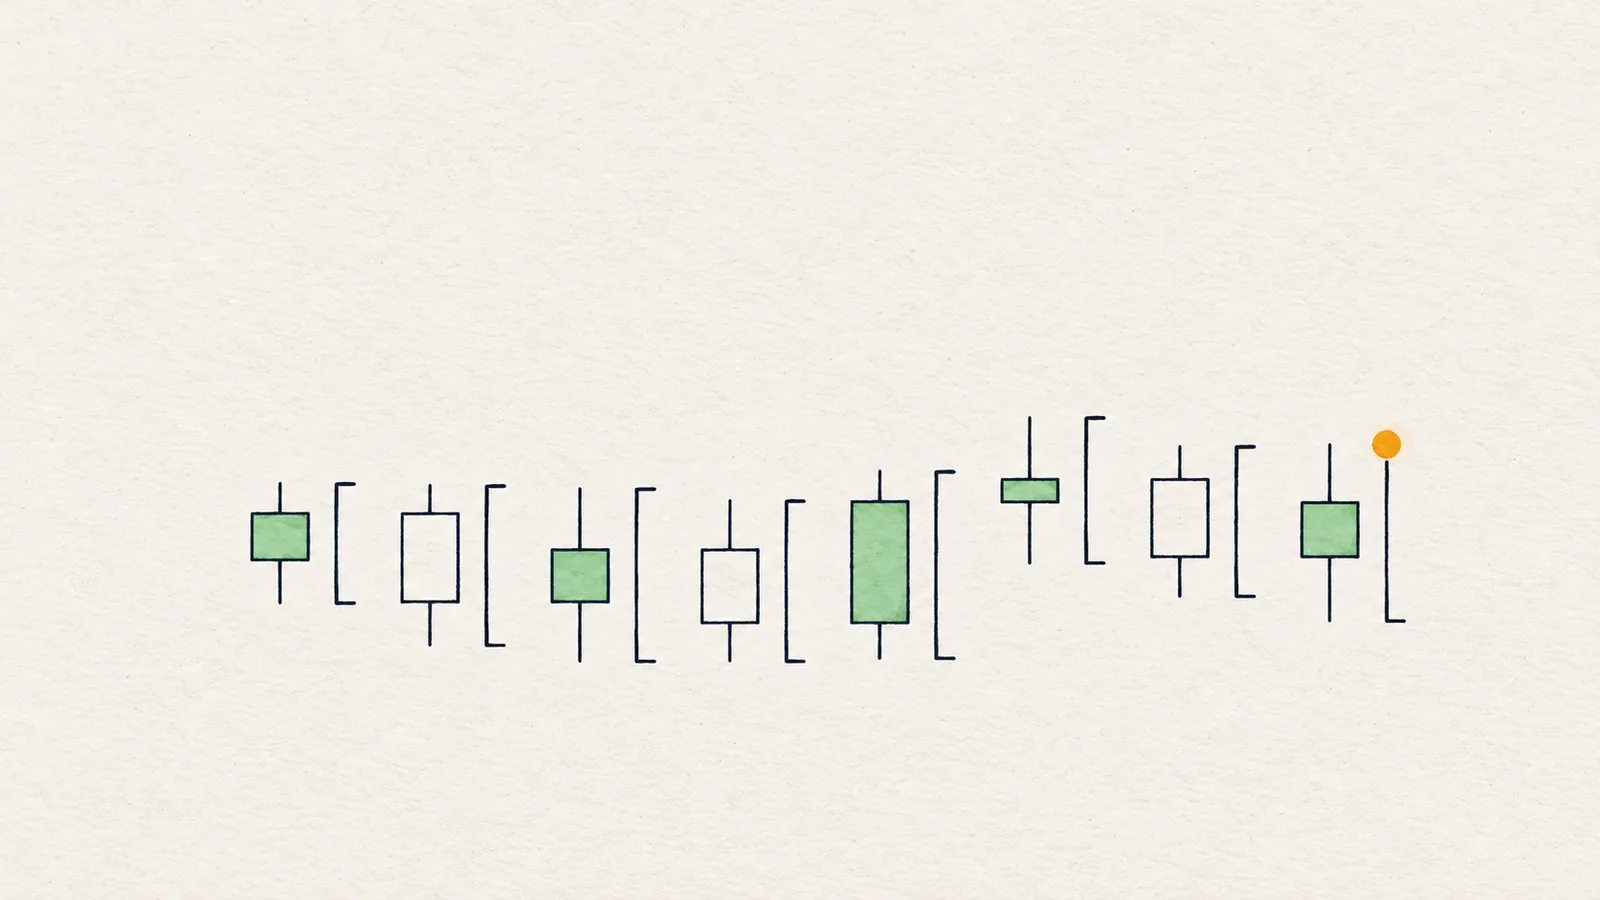 ATR indicator: what it is and how to use it for distance and stopsATR tells you how big a normal candle is right now. Measure distances in ATR and the same rule works on Bitcoin and on a small altcoin.
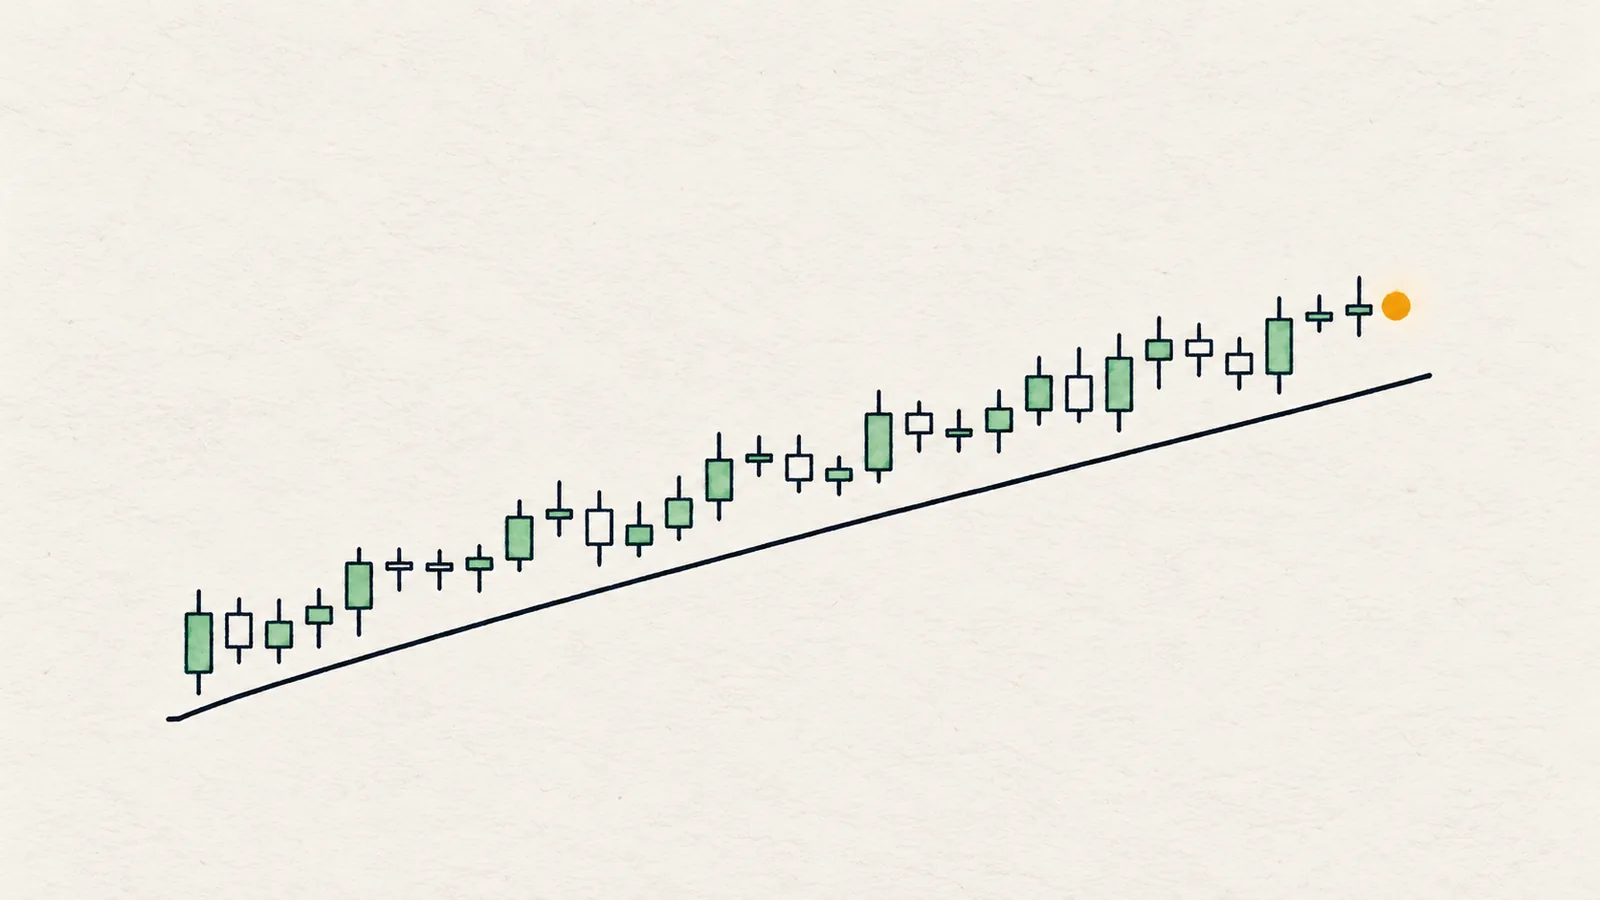 50 EMA as a trend filter: distance, slope and what it can't doThe 50 EMA is a filter, not a level. Check how far price sits from it and which way it slopes before you call anything a trend.
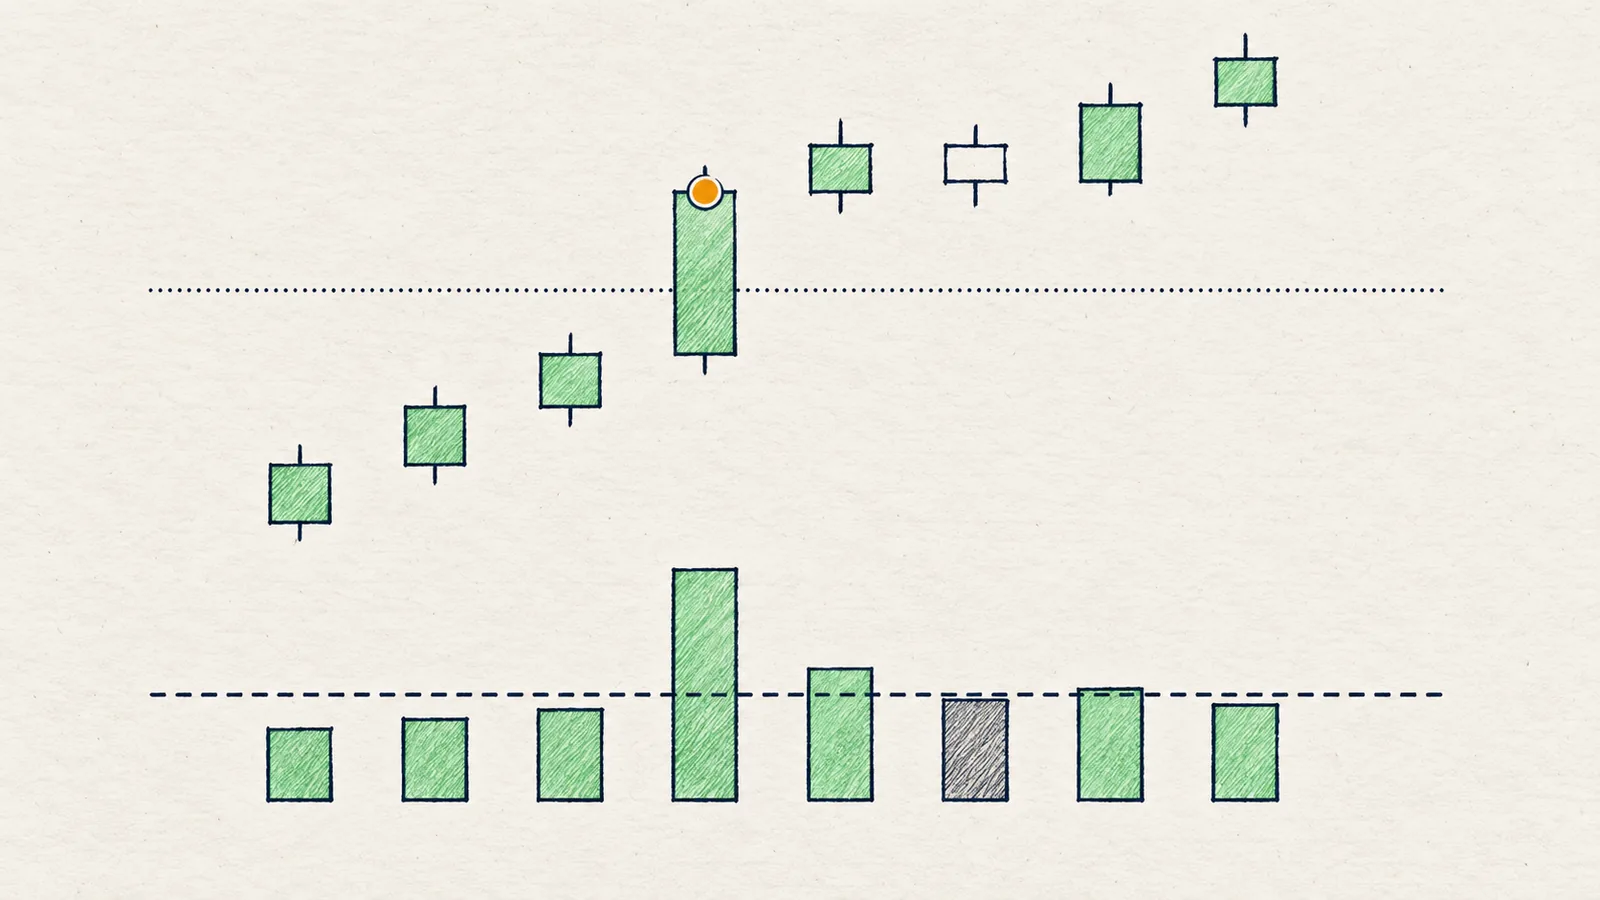 Volume confirmation: how to read volume on a crypto breakoutA breakout on thin volume asks for trust it has not earned. Compare the last candle with its recent average before you believe a move.
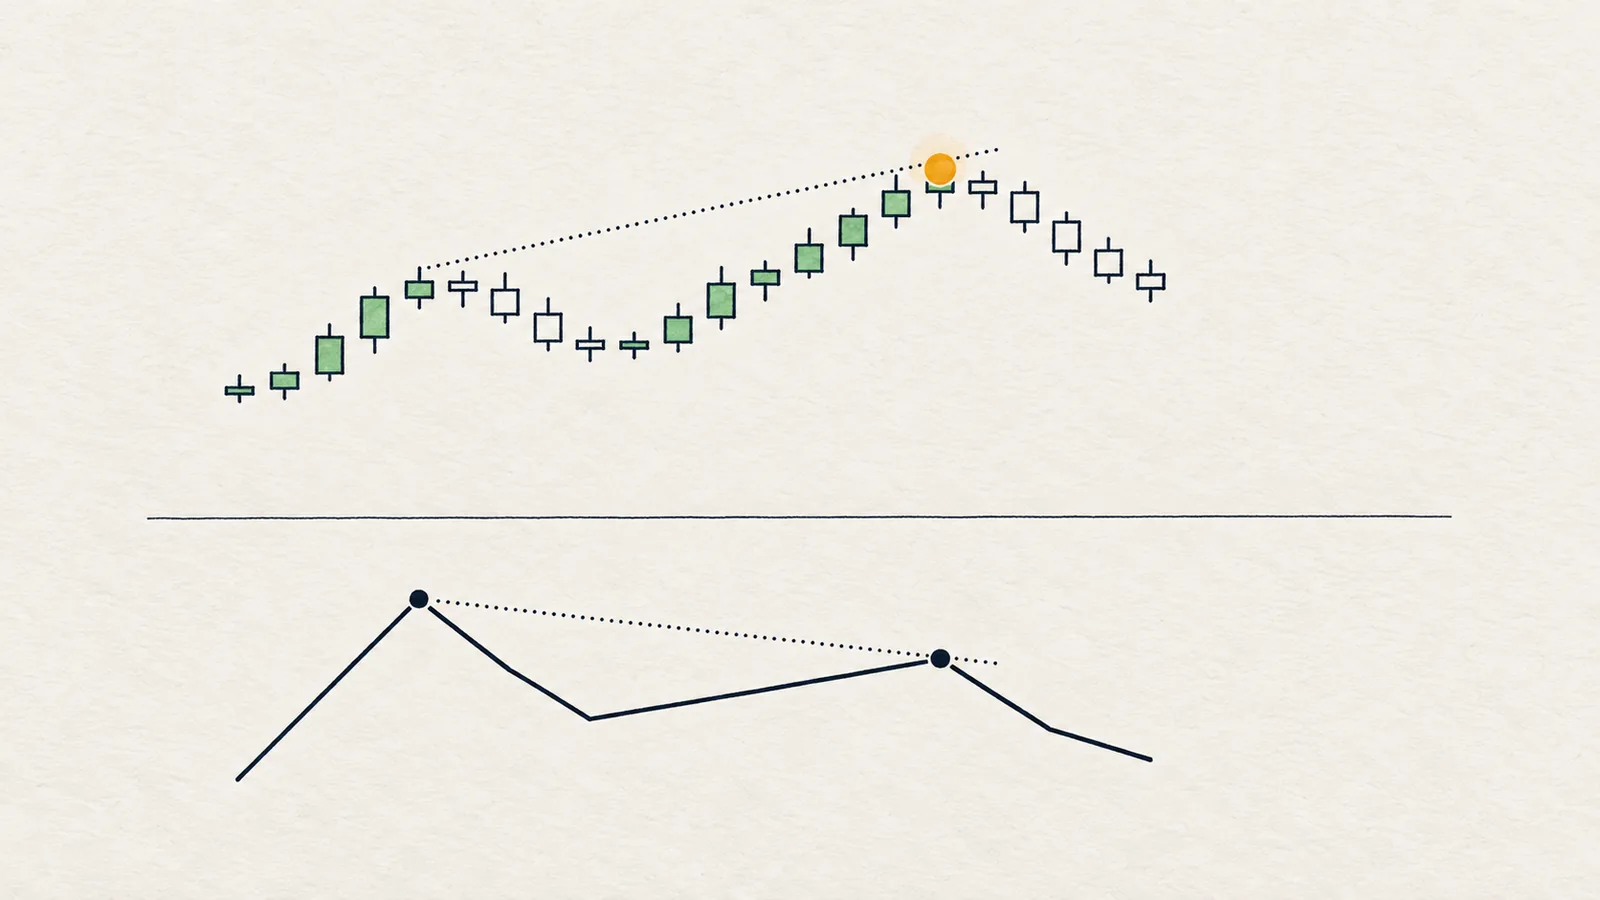 RSI divergence: what it says, what it doesn't and how to misuse itDivergence says momentum is fading, not that price will turn. Learn to find it between two confirmed swings and to treat it as a caution.
Derivatives
What futures traders are doing
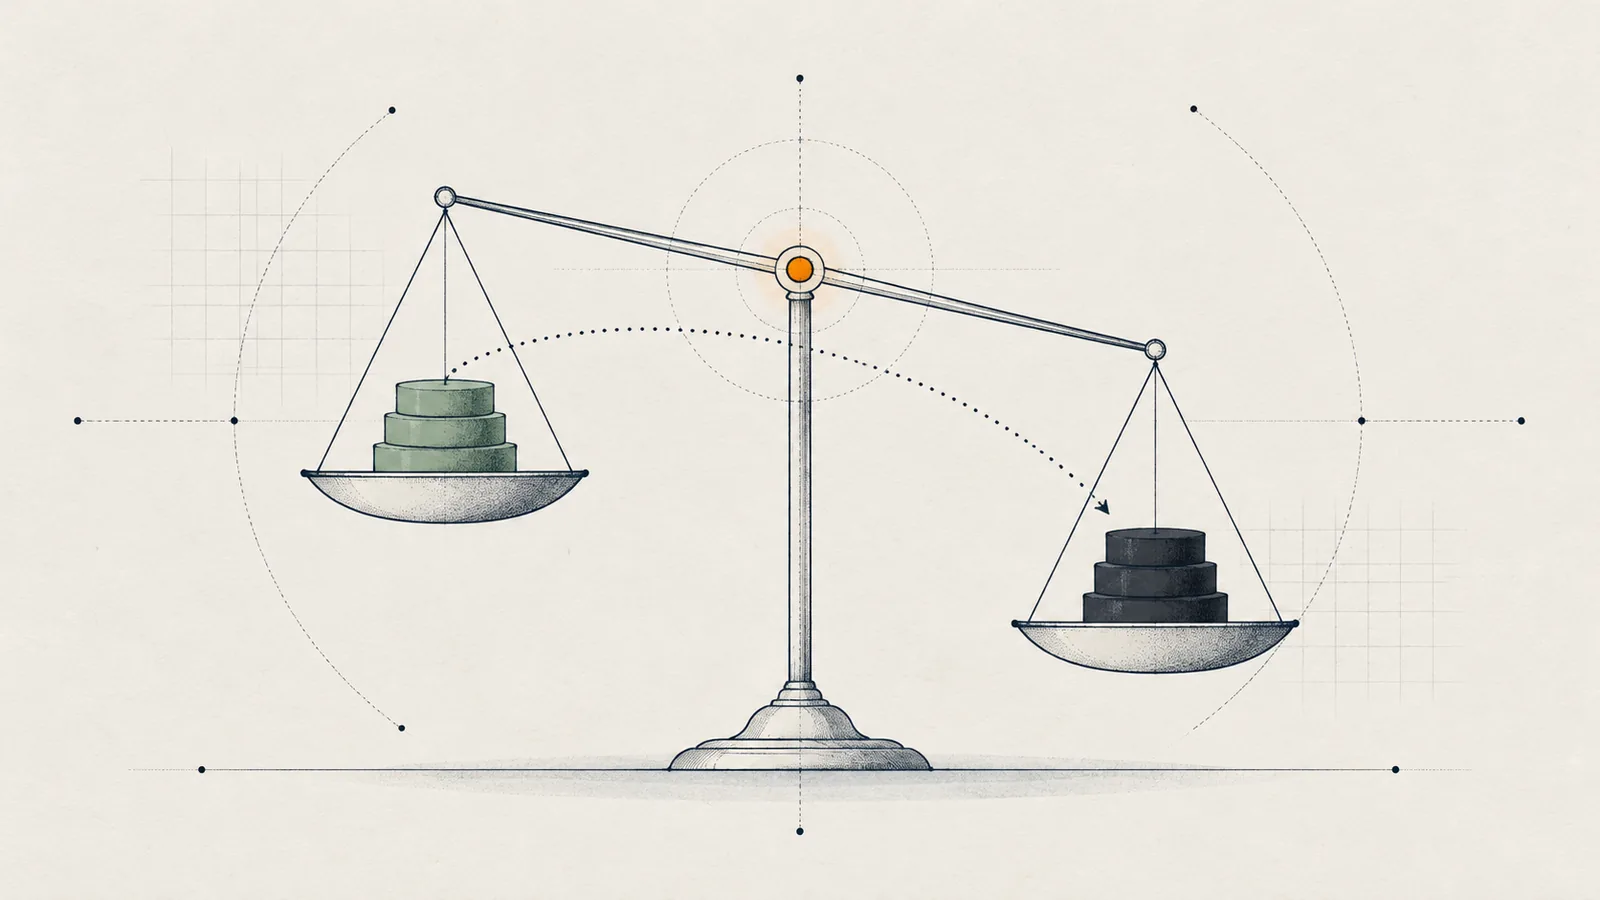 Funding rate in crypto: who pays whom and what it can really tell youFunding is a small payment between longs and shorts that keeps perpetual futures near spot. Read it as a gauge of crowding and carrying cost, never as a direction call.
 Open interest in crypto: what it measures and how to read it with priceOpen interest counts positions that are still open. Paired with price and funding it tells you whether a move has participation behind it, but never who is on which side.
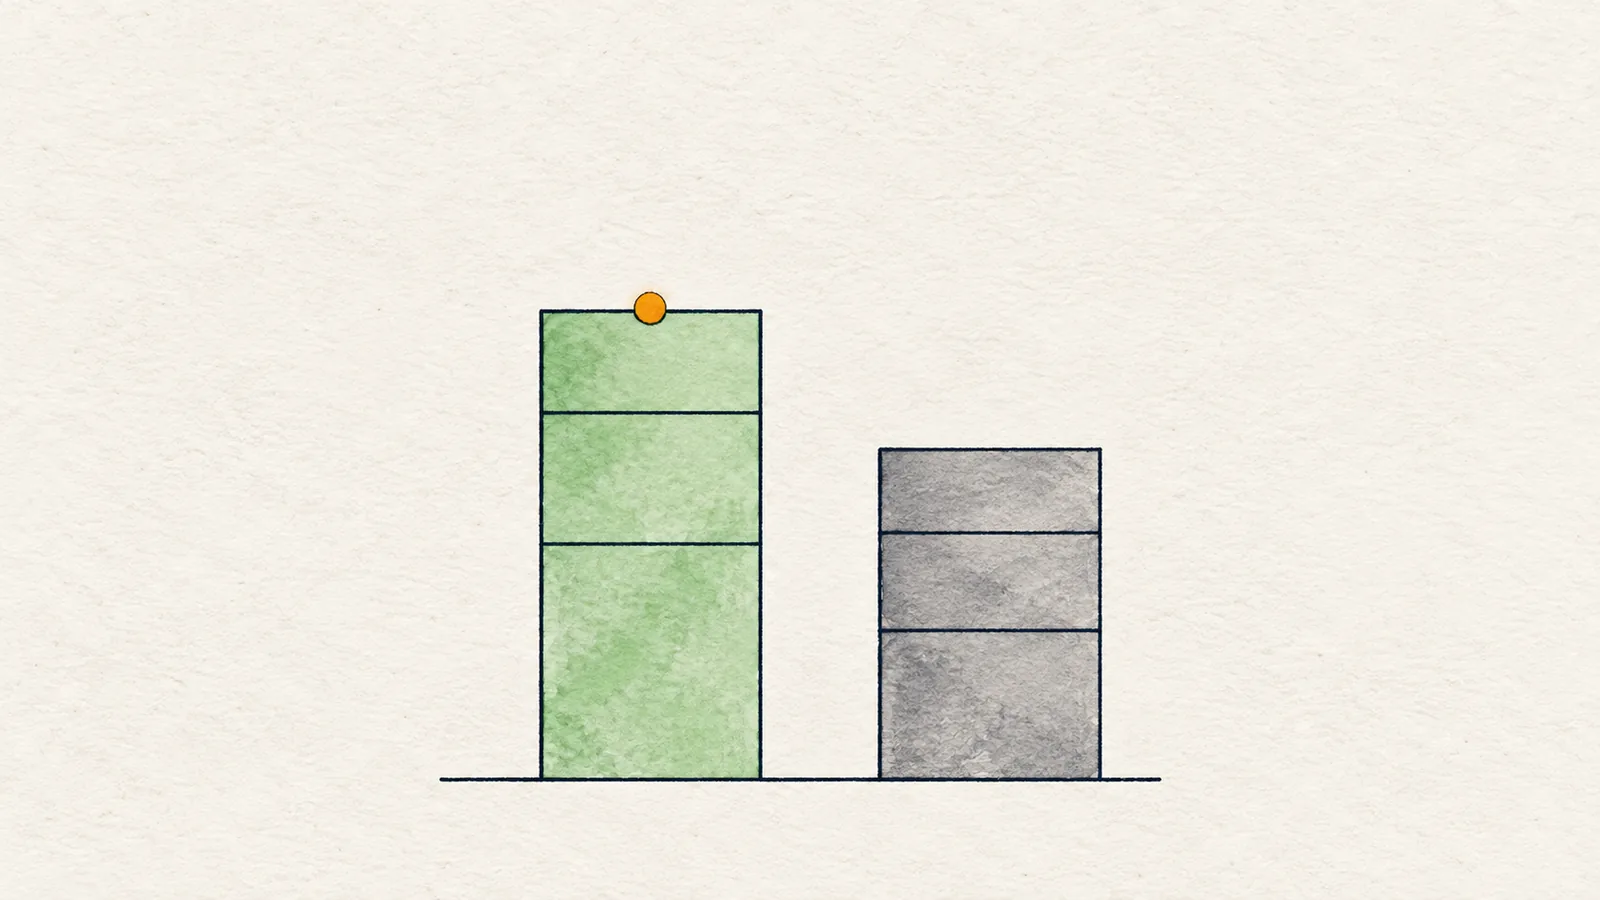 Long/short ratio in crypto: what it shows, and why a high number is often normalThe long/short ratio counts who is positioned long versus short. It only says something useful when taker flow or funding agree, and it is a poor contrarian trigger on its own.
Practice
Plans and pitfalls
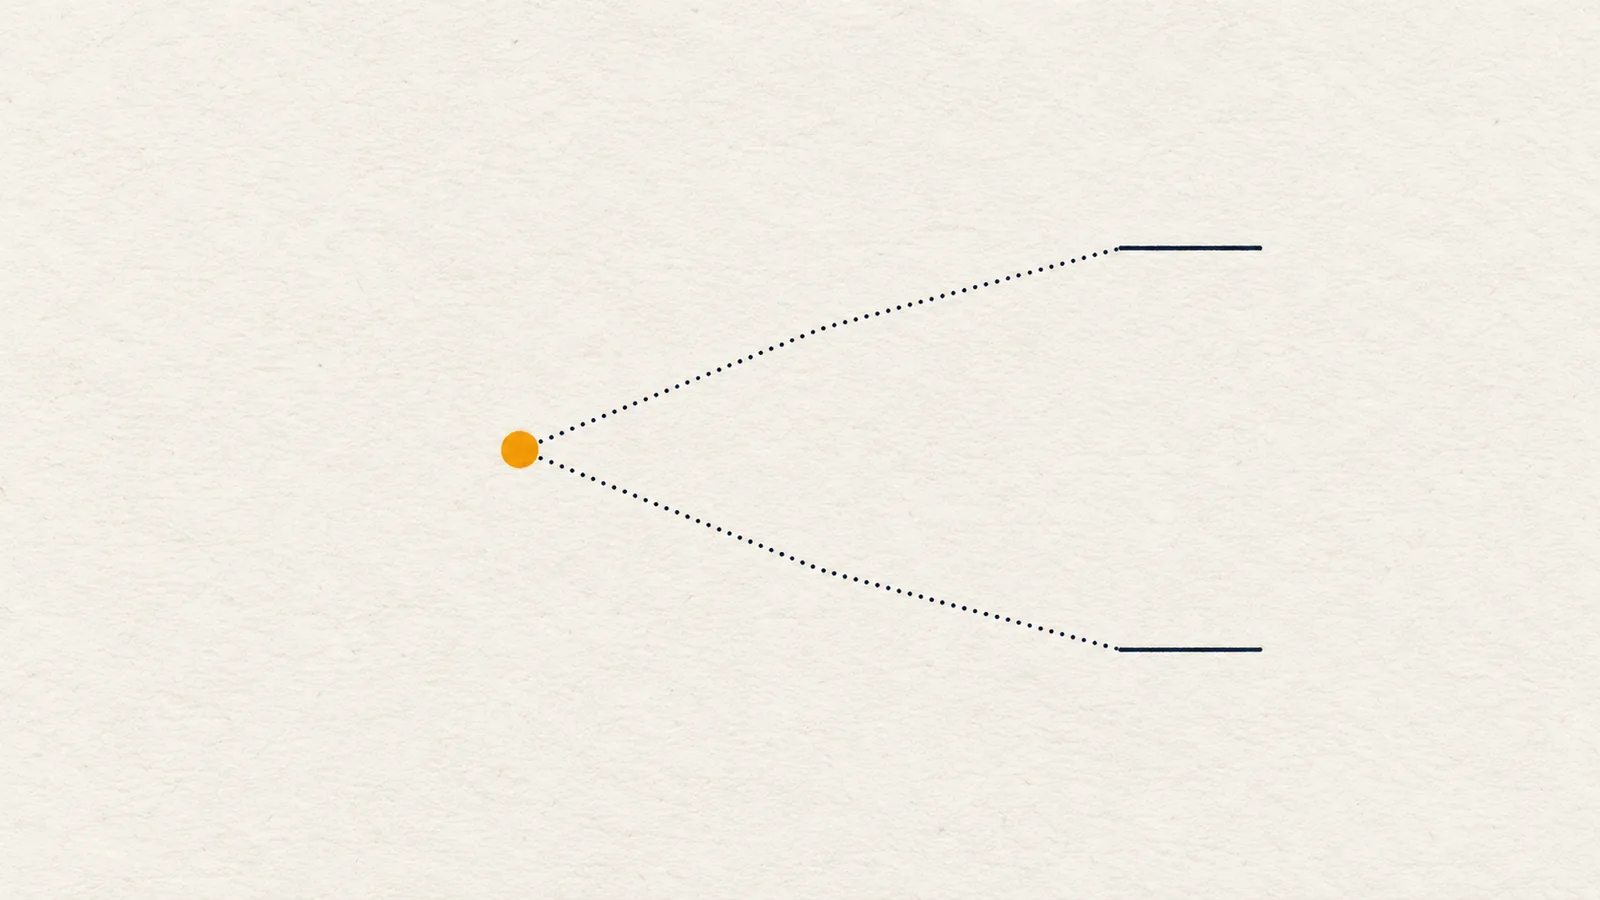 Trading scenarios and invalidation: how to plan with if/then instead of predictingA scenario says what you will do if price does X, and which price proves the idea wrong. It replaces guessing with a plan you can check.
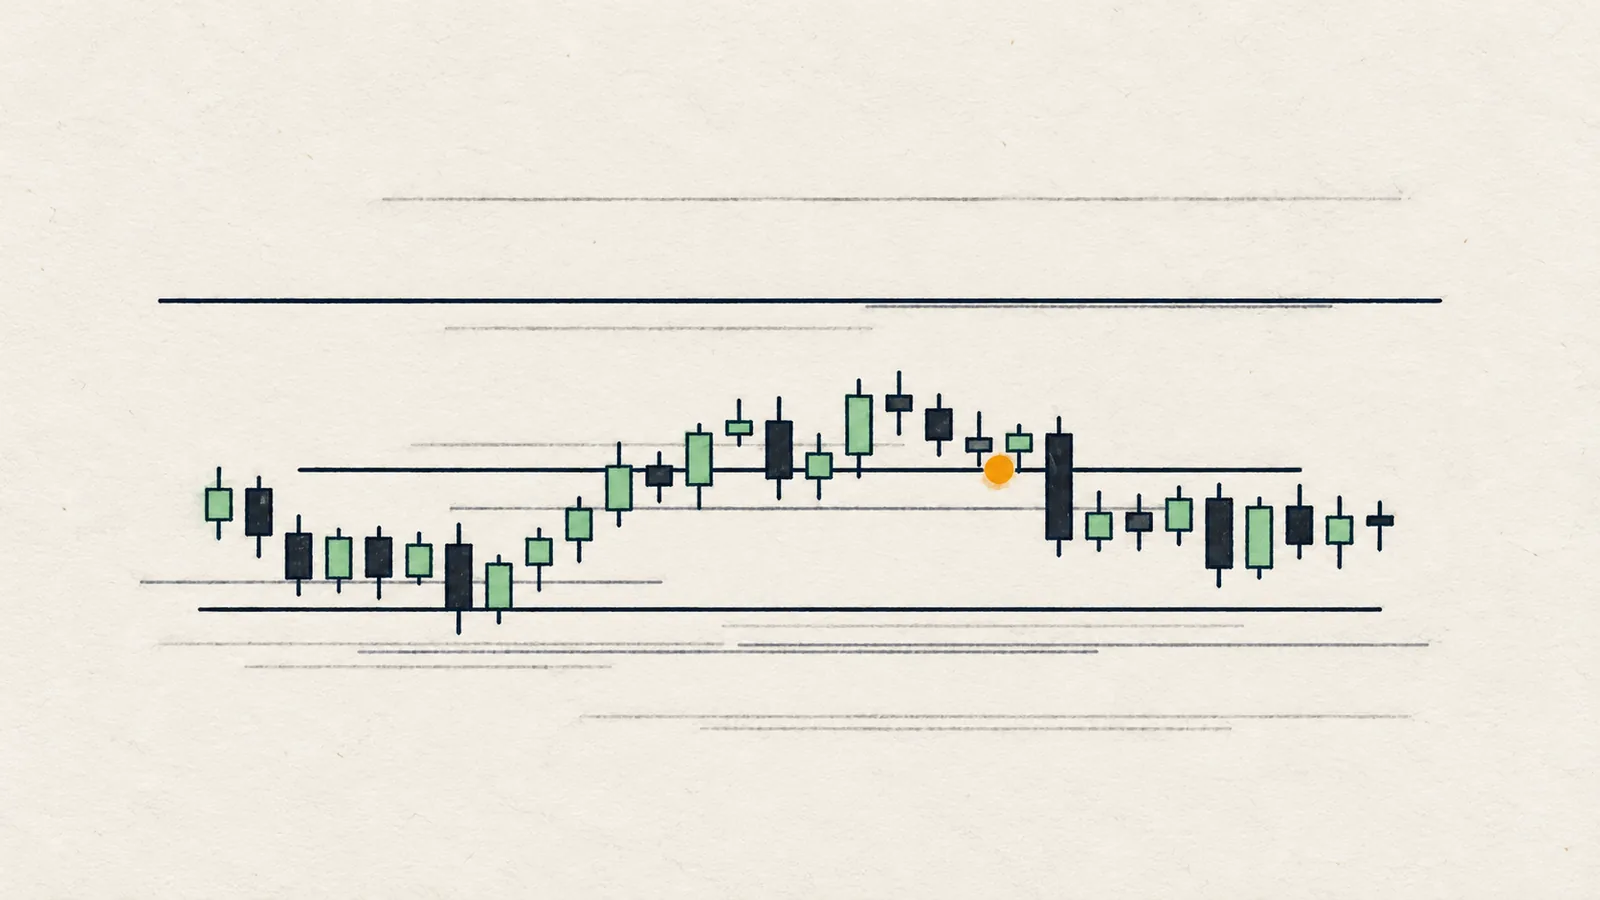 Chart reading mistakes: 10 common errors in crypto technical analysis and how to fix themMost bad reads come from the same ten habits. Here is what each looks like on a chart, why it hurts and the small change that fixes it.
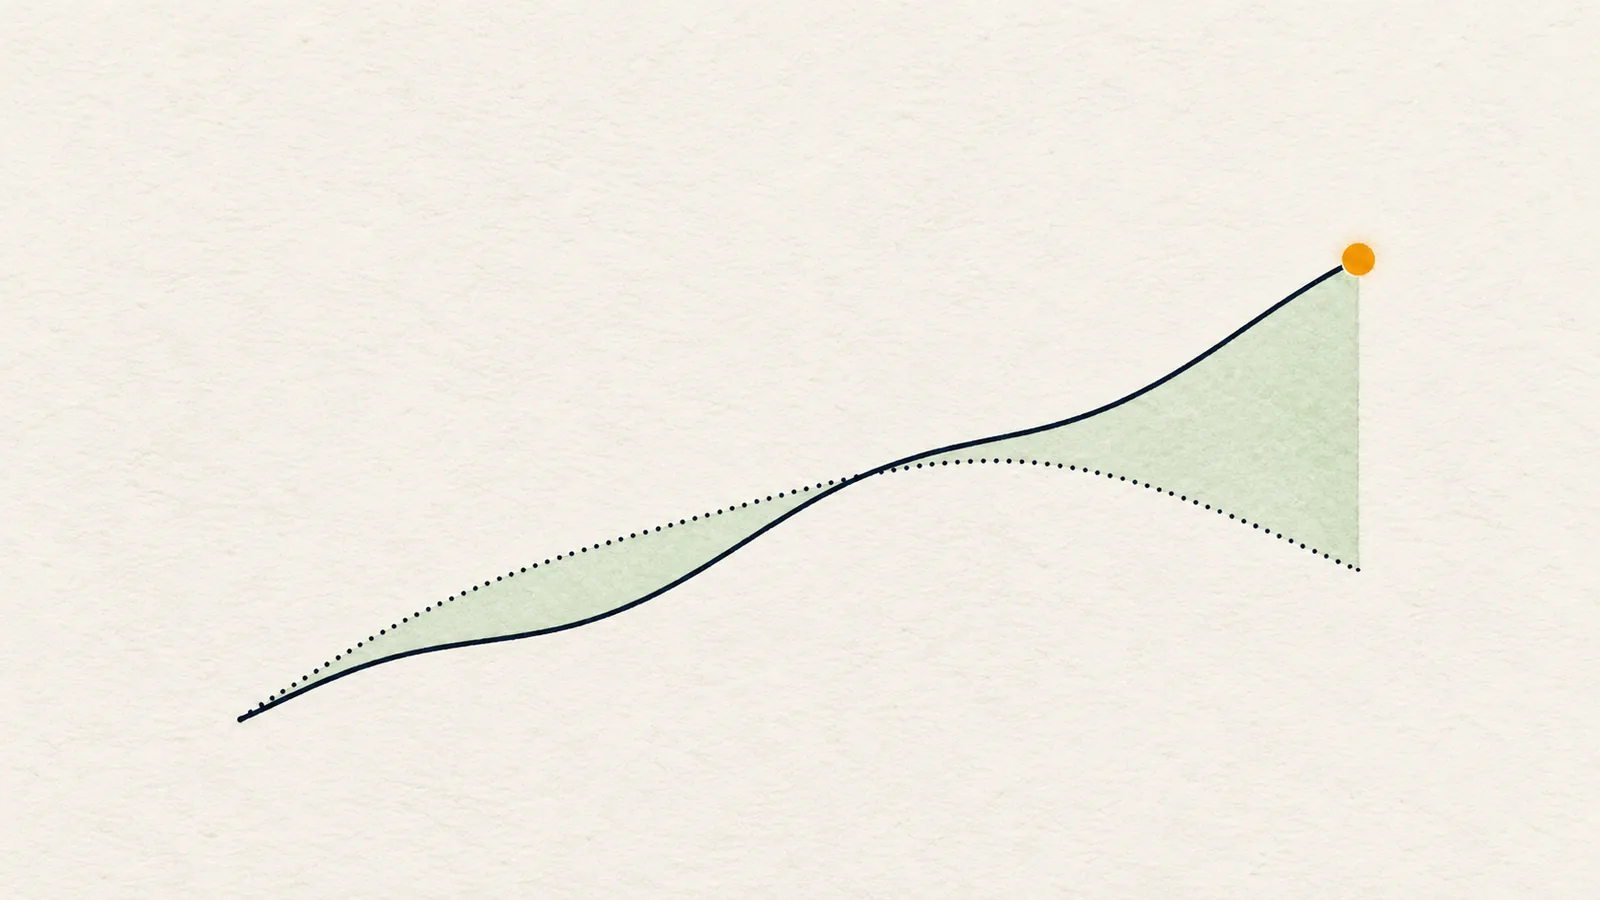 Altcoin strength vs Bitcoin: how to read relative strength as contextRelative strength asks whether a coin is doing better or worse than Bitcoin. It is useful context for a plan, and a poor trigger on its own.
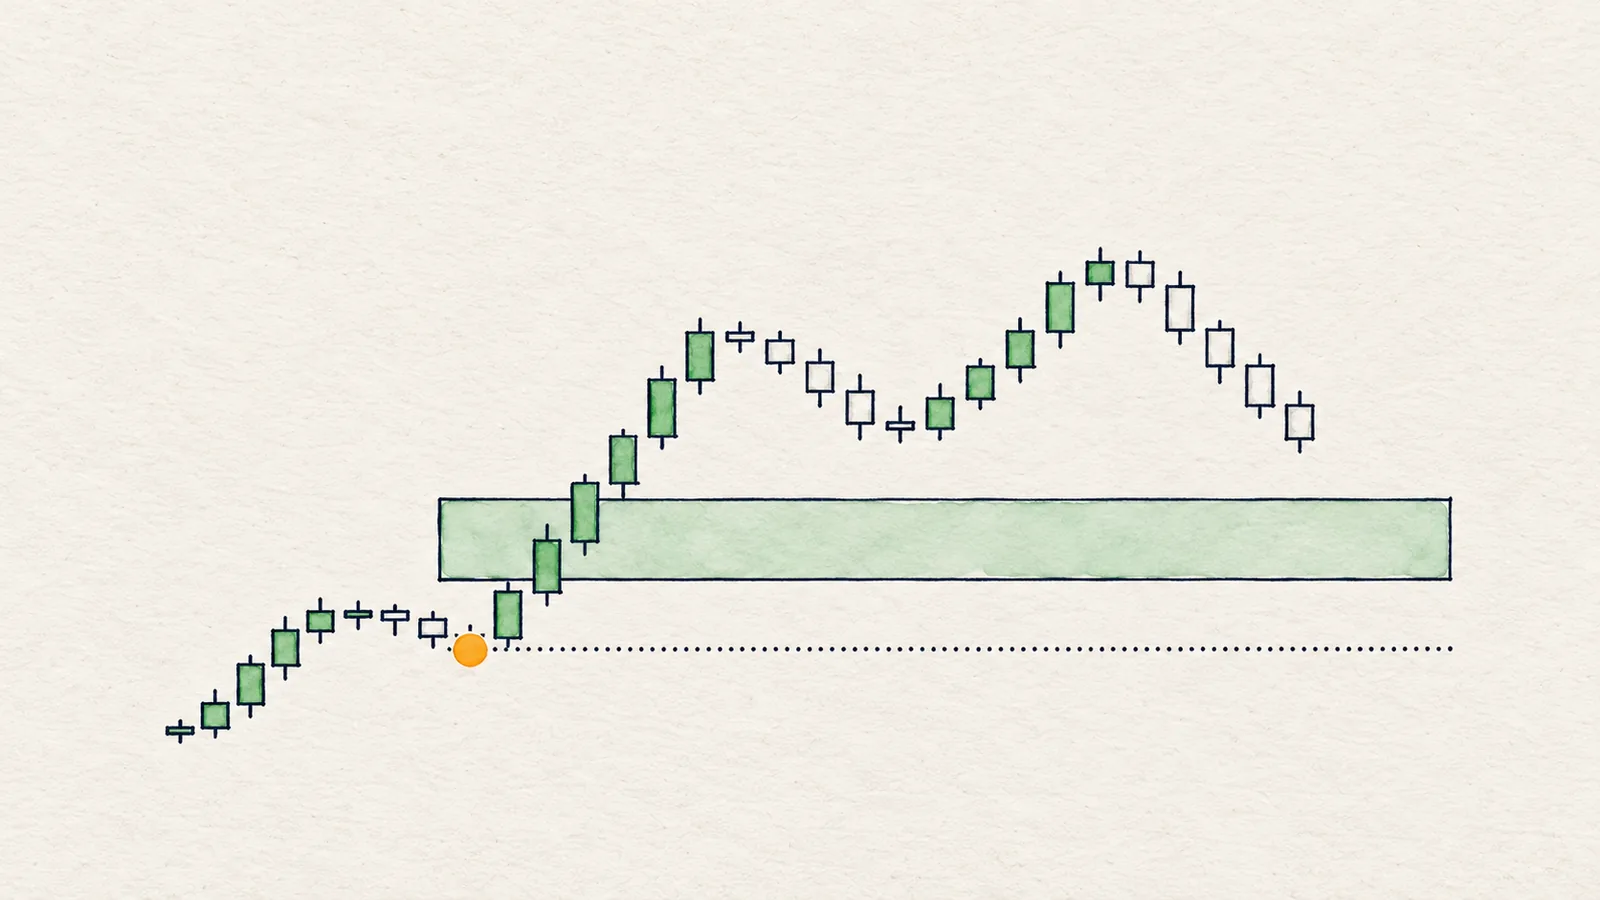 Where to place your invalidation level: protecting swings, distance and position sizeInvalidation is the price that proves your idea wrong. Choosing it from structure, at a sensible distance, comes before deciding how big a position can be.