Volume confirmation is the practice of checking whether trading activity supports a price move, usually a breakout. The idea: when price breaks a level, more participants being willing to trade at the new price makes the break more credible than the same break on thin activity. The usual measure is relative volume, the latest candle's volume against its recent average.
Volume is the most misread number on a chart. It is easy to see and hard to interpret. This guide explains what volume is, how to compare it sensibly (the 20-candle average), how to estimate whether buyers or sellers carried it, why crypto volume is noisier than it looks, and what low-volume breaks tell you.
What does volume show on a candle?
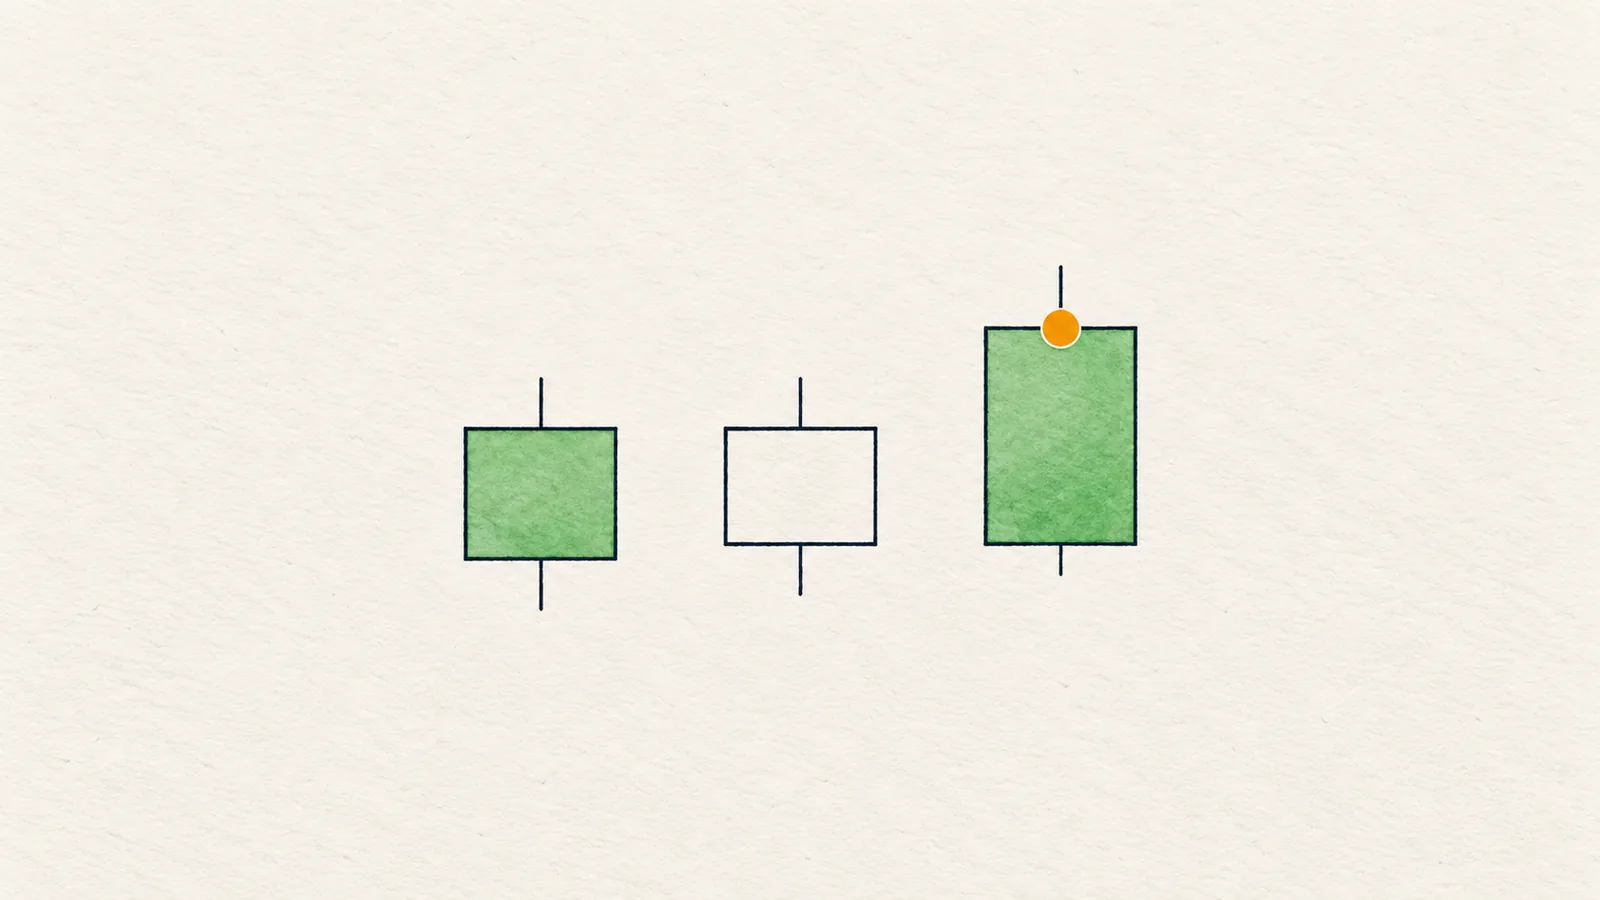
Volume is the total amount traded during the candle, in the coin or in the quote currency. A tall volume bar means a lot changed hands; a short bar means little did.
What volume does not show on its own is direction. A tall bar under a green candle and a tall bar under a red candle are both "a lot traded". The number says how much attention a candle got. Whether that attention was constructive depends on the candle's shape, the level and the context.
How do you compare volume with something that matters?
A raw volume number is meaningless without a baseline. 5000 units might be a quiet candle on one coin and a record on another.
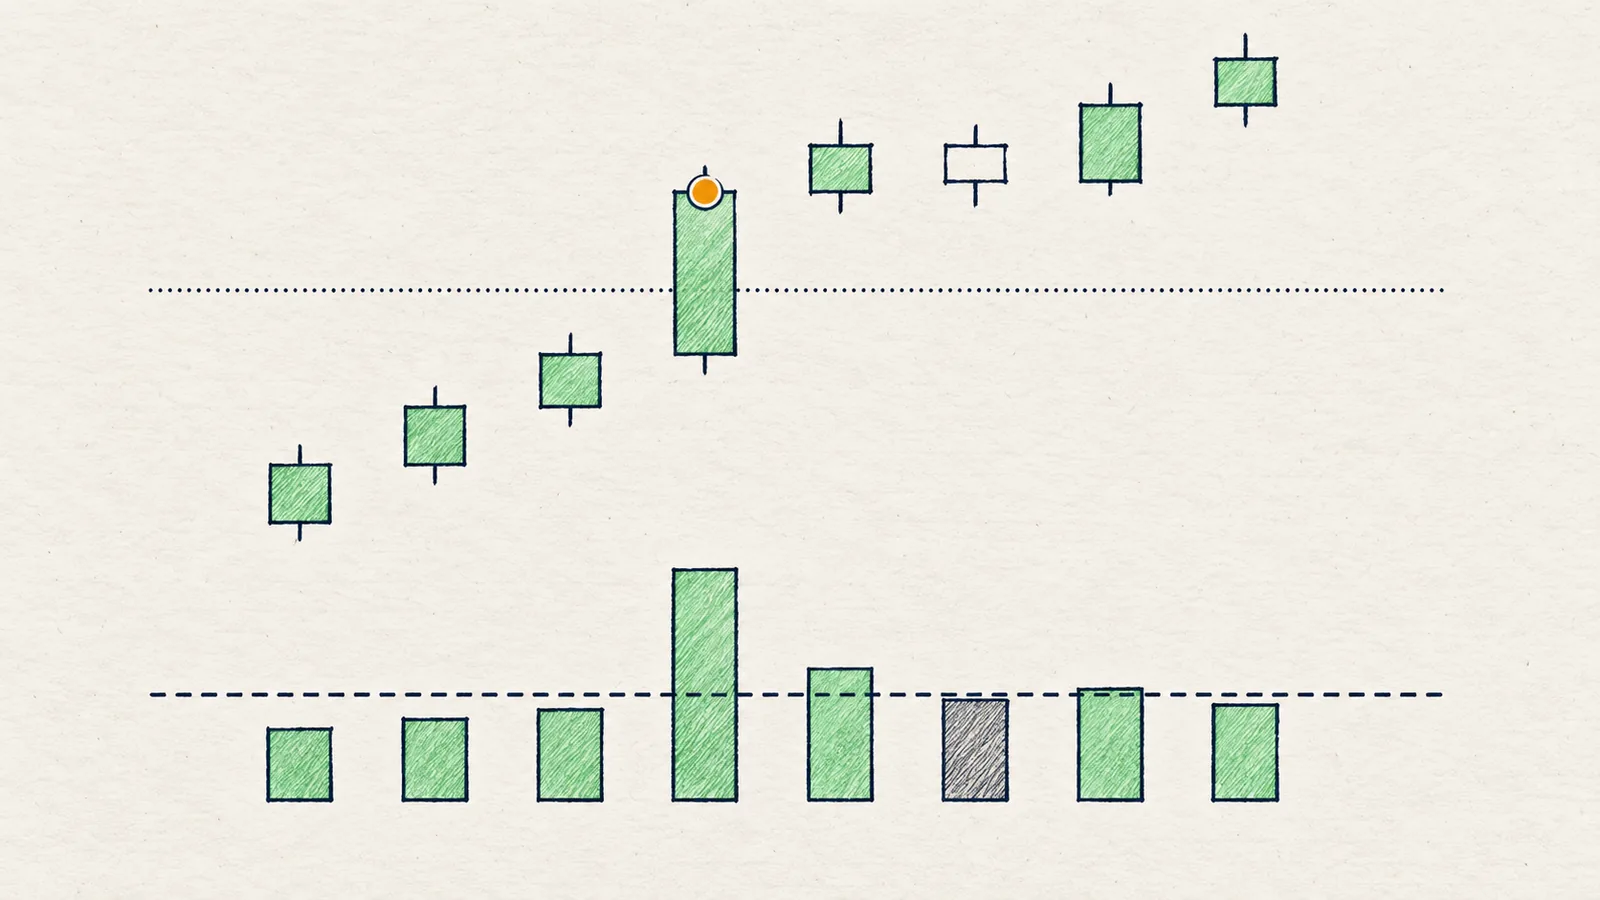
The standard fix is relative volume: the last candle's volume divided by the average of the previous N candles. With N equal to 20:
- 1.0x means volume is about normal.
- 2.0x means twice the usual activity.
- 0.5x means half of it.
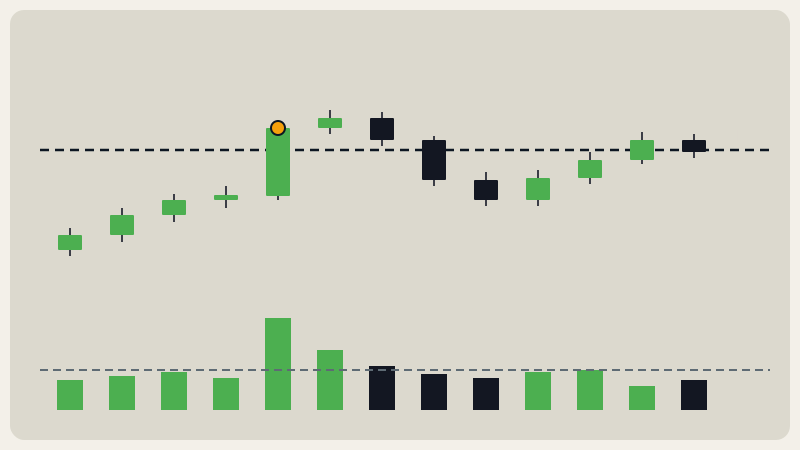
Twenty candles is a convention. It is long enough to smooth out one odd candle and short enough to reflect the current regime. The key habit is to always ask "compared with what?" and to use the same baseline every time.
How should you read volume on a breakout?
Volume on the breaking candle (judged at its close, see candlestick basics) fits a few cases:
- Break on clearly above-average volume. More participants accepted the new price. It adds credibility, not certainty.
- Break on average volume. Ordinary participation. The break must prove itself afterwards, for example by holding on a retest.
- Break on below-average volume. Few joined. The risk of a fake-out is higher, and it is reasonable to wait.
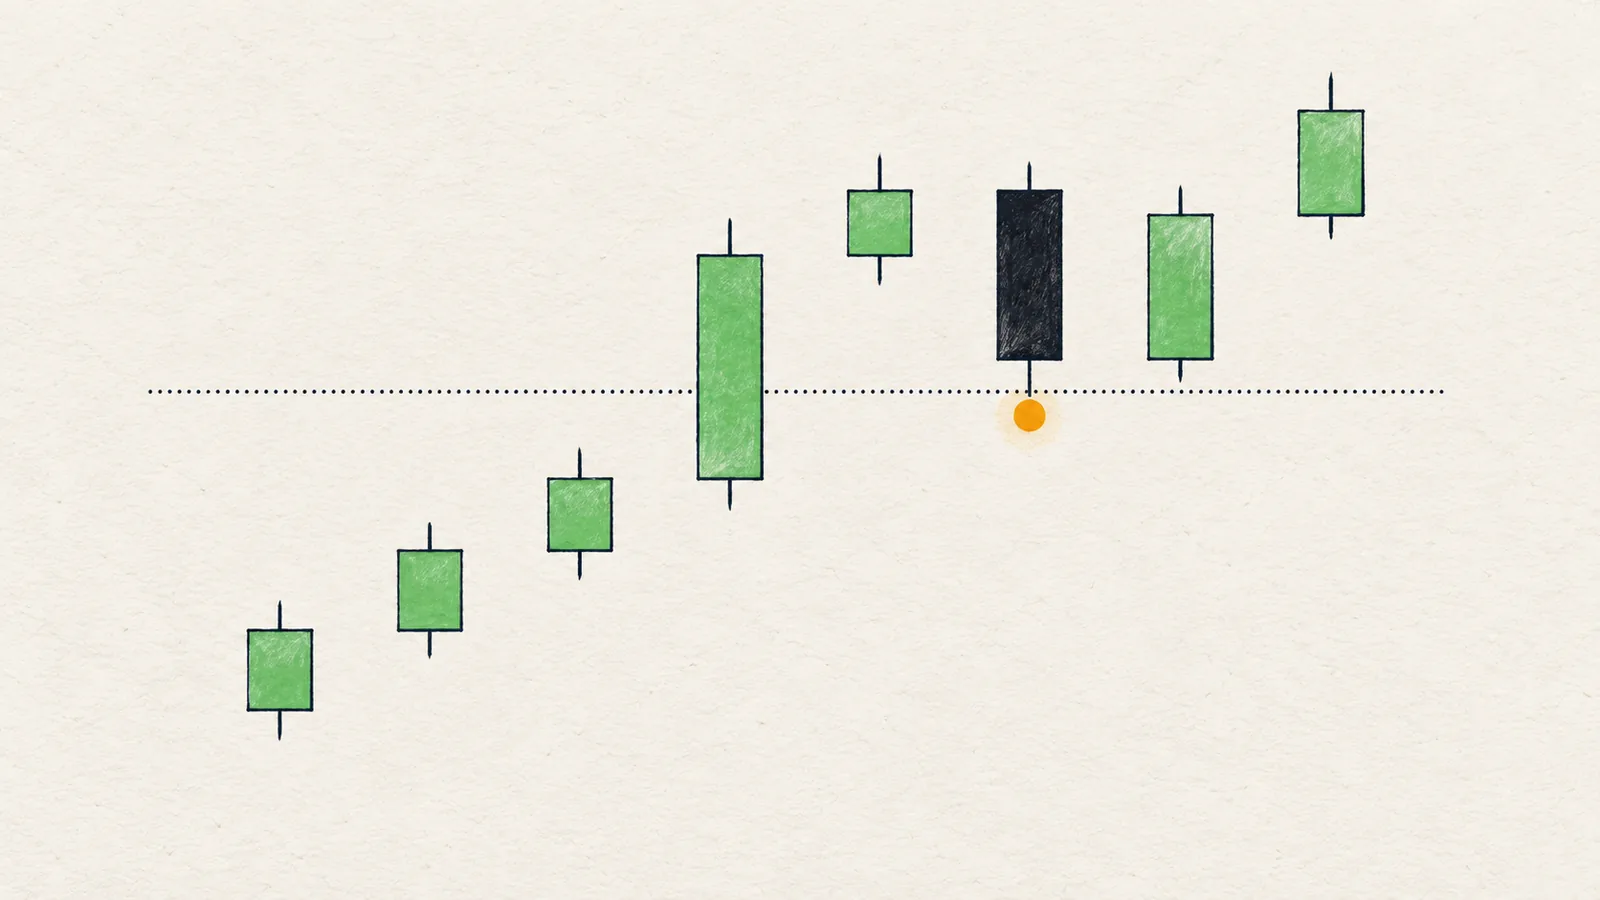
- Spike on a wick, no follow-through. A large volume candle that rejects a level and closes back inside tells you the level was defended hard.
Volume does not replace the close. A candle that closes beyond a level on low volume is still a break by definition, but how much to trust it is another matter. What happens next is the topic of breakout and retest.
Which side carried the volume?
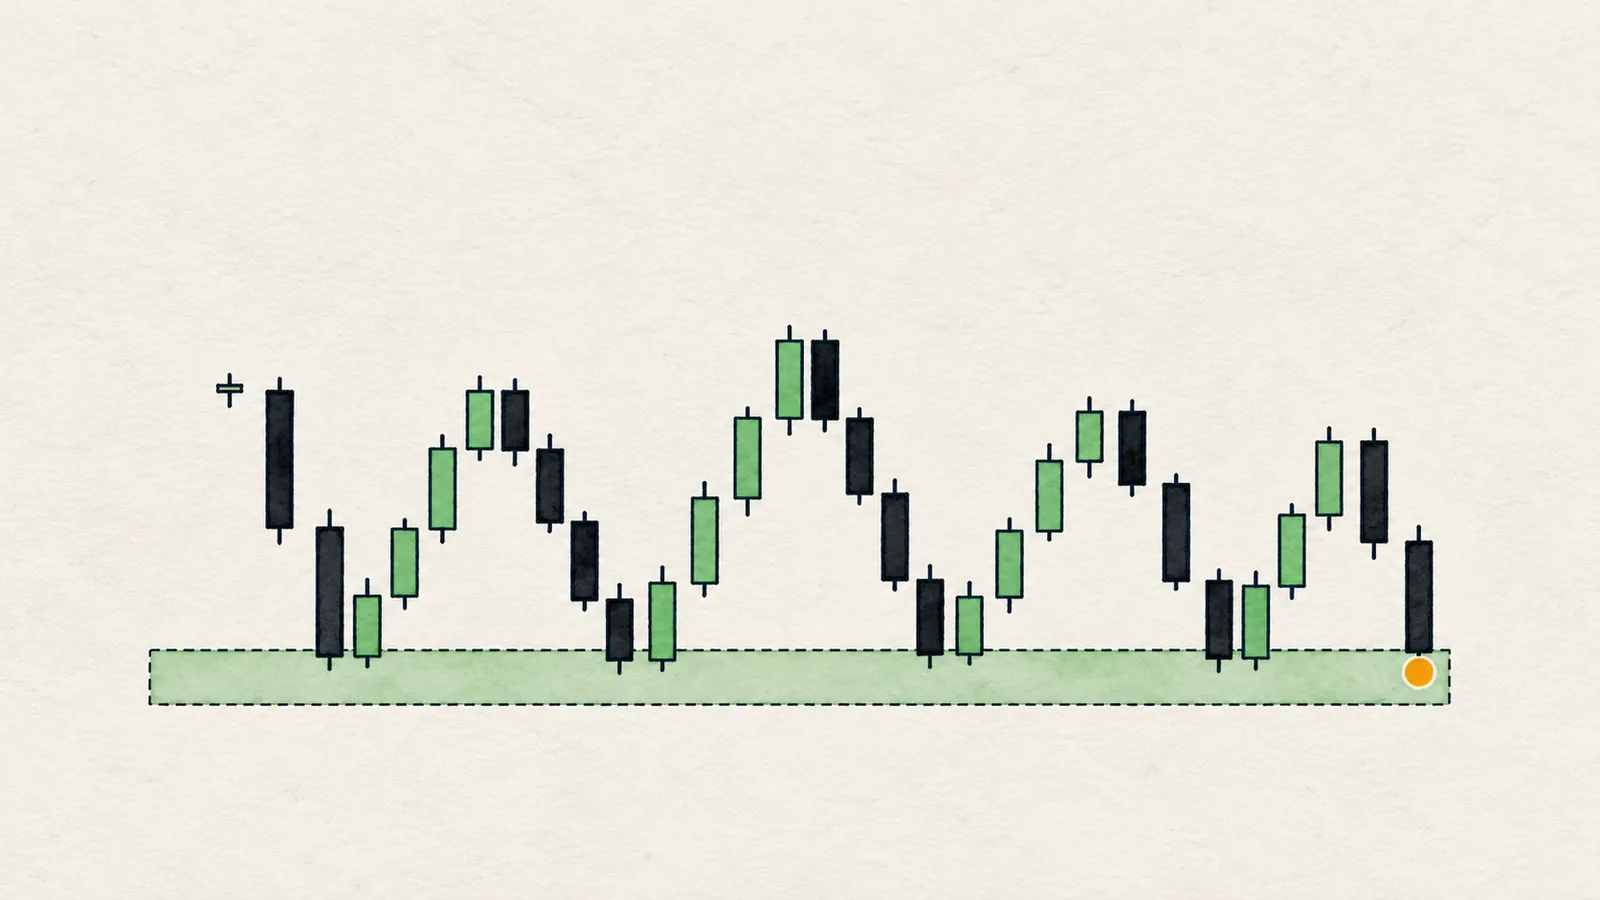
Volume alone is neutral, so traders try to split it. Candle data does not label every trade as buyer or seller, so the common approximation is simple: over a window, add up the volume of up candles and the volume of down candles and compare.
If up candles carried clearly more volume than down candles, buyers dominated the window. If down candles did, sellers did. If they are close, neither did.
This is a rough estimate. A single large down candle can tilt it, and a candle that closed up may have had heavy selling inside it. Use it as context, not proof: a breakout up with buyers leading volume is better supported than one up while sellers lead.
Why is crypto volume noisy?
- Fragmentation. The same coin trades on many exchanges and in spot and futures markets. Any one source shows a slice.
- Time of week. Weekends and quiet hours have thin volume, so a normal-looking move can show a high relative volume on little real participation.
- Events. News, listings and liquidation cascades produce spikes that say little about steady interest.
- Different size by coin. Large coins have deep, steady volume; small ones can swing wildly from candle to candle.
The practical lessons are to compare volume only with the same coin's own recent history, to use more than one candle of evidence, and to treat one spike as an event, not a trend.
How do you use volume at a level before the break?
Volume is useful before a breakout too. As price approaches a level and candles get smaller while volume dries up, the market is compressing; nobody is in a hurry. Then a candle arrives with much larger volume. That change, from quiet to loud, is more informative than any single reading, because it shows participation arriving. The reverse also matters: price grinding into a level on rising volume and then stalling suggests the level is absorbing orders, which fits what support and resistance describes as a place where orders sit.
None of this replaces reading the structure first. Volume says how much attention a move got, and structure says what the move means.
What does a low-volume breakout tell you?
It tells you that the new price did not attract much trading. That does not make the break false, but it changes the plan. Instead of treating the break as established, you wait for proof: a retest that holds the level, a second close beyond it, or volume rising on the follow-through.
- If price closes beyond the level on below-average volume, then I treat the break as unconfirmed and look for a retest or for volume to expand.
- If instead price falls back inside and closes under the level, then the break failed and the idea is off.
Honest note: Volume does not predict which way price goes. High volume breakouts fail and low volume breakouts succeed. Volume only adjusts how much weight a move deserves; it is a supporting witness, not a verdict.
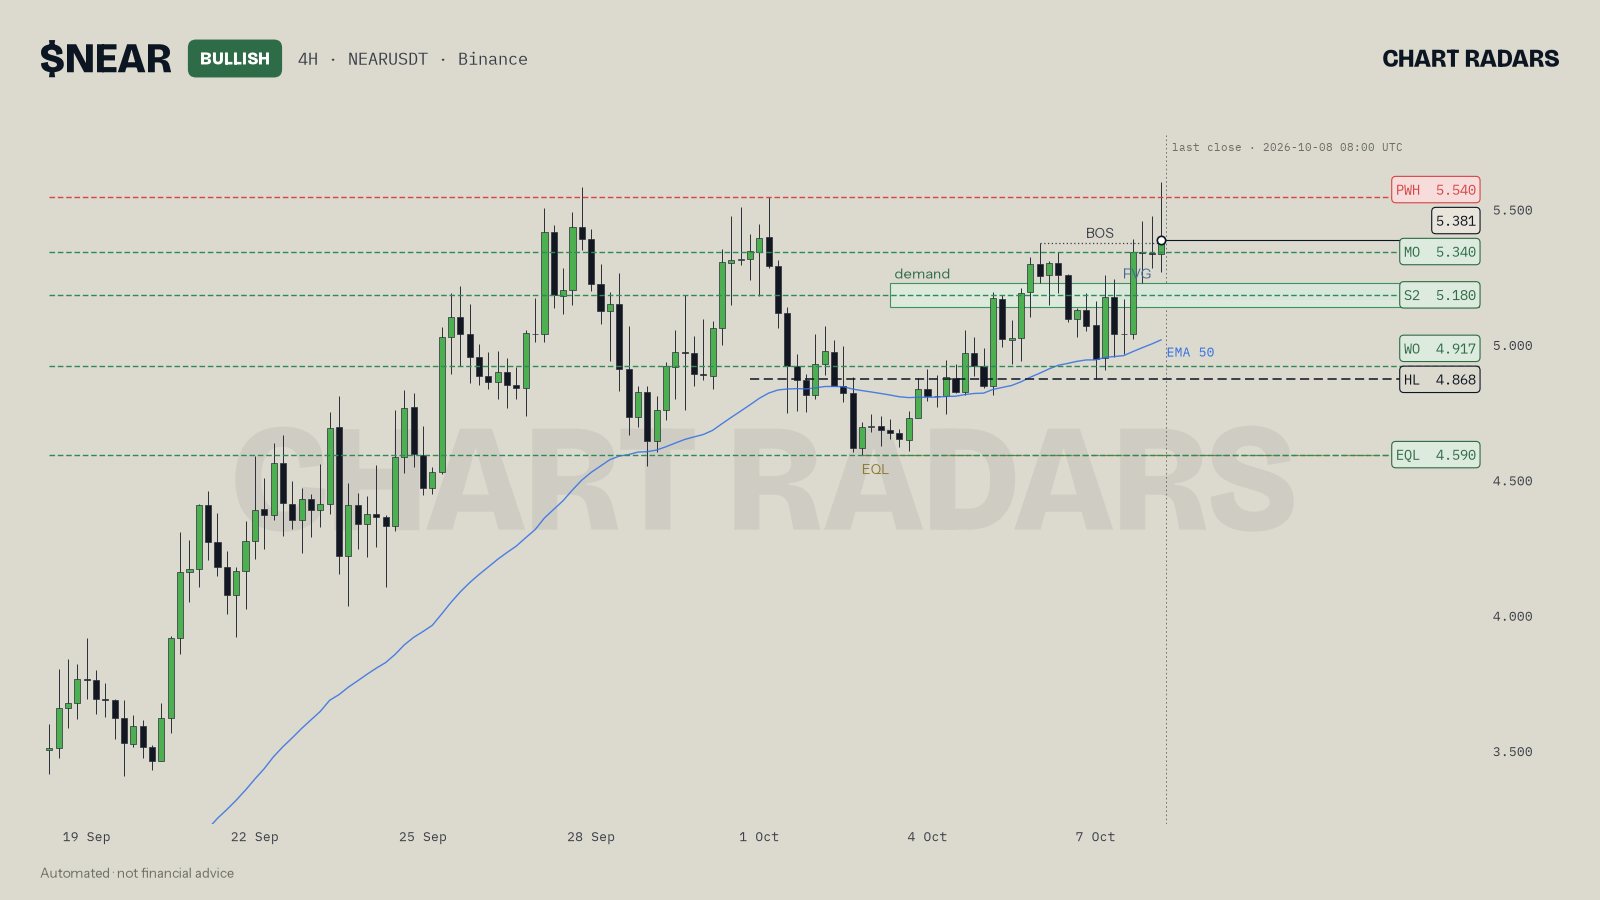
On NEAR 4H, close of 8 Oct 2026, the read says volume is running at 2.3 times its recent average and that over the last stretch buyers have dominated volume. That is the kind of backing a move wants. It also notes the 5.540 prior-week high is still to be beaten on a 4H close; the last candle's wick went above that line but the close, 5.381, did not. Strong volume with the level not yet beaten is a good reminder that volume supports a move that has not yet happened.
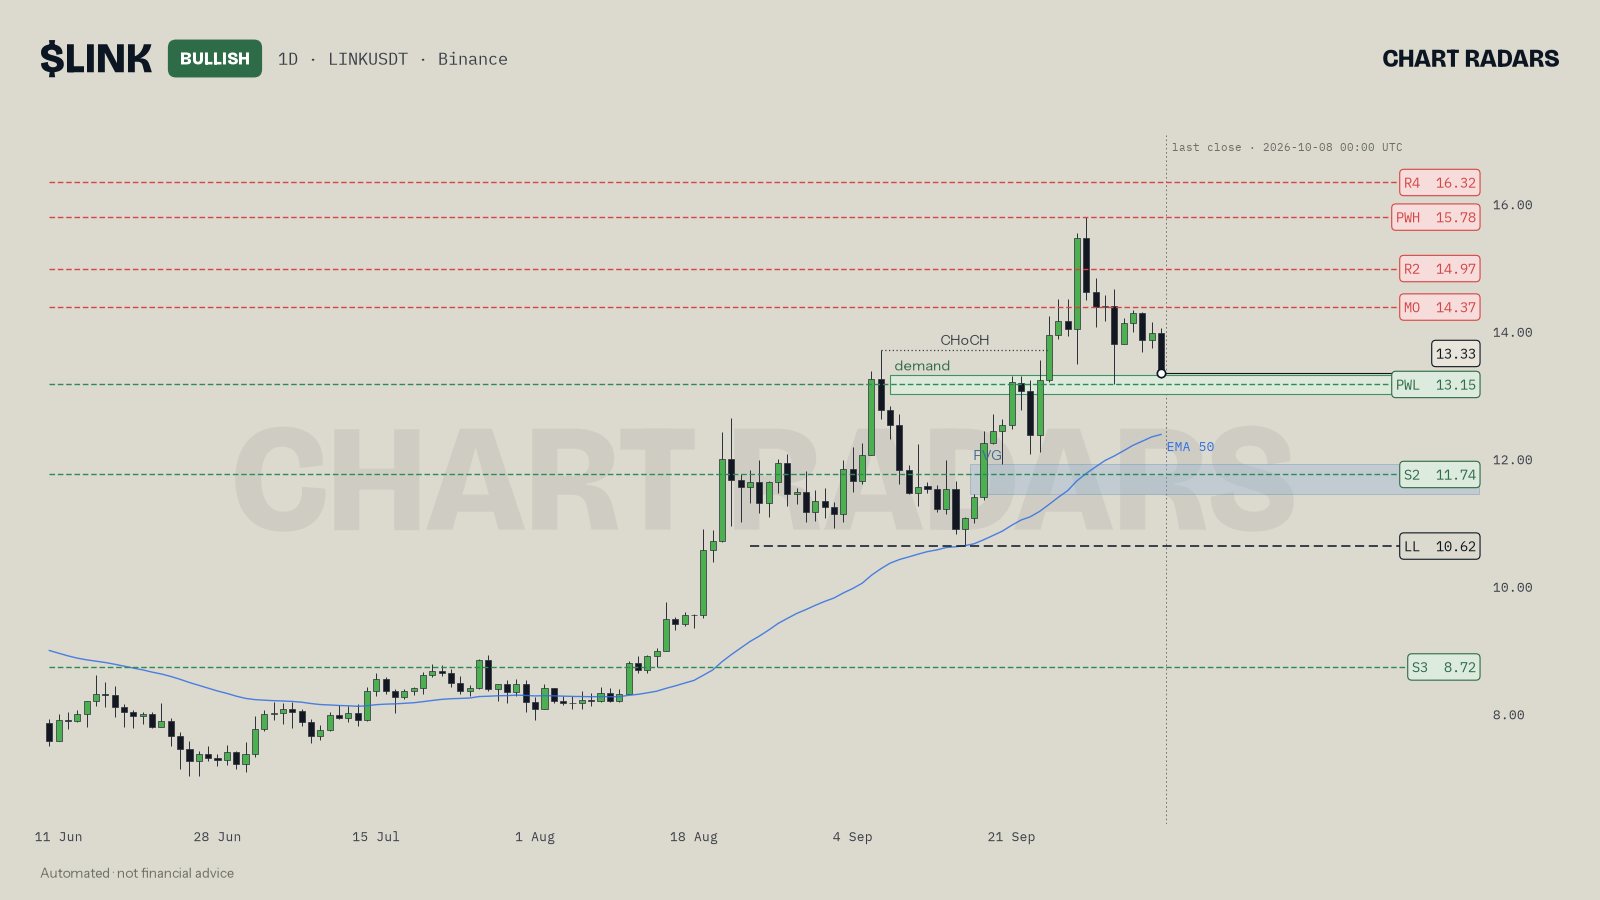
On LINK 1D, close of 8 Oct 2026, the picture is the reverse. The read says volume is at just 0.5 times average and that a move there could easily be a fake-out, even though buyers have led volume in the recent stretch. It plans to buy only on a rejection wick, a bullish engulfing or a lower timeframe shift. The read's lesson: a thin day does not cancel a plan, it raises the bar for trusting a break.
In Chart Radars: relative volume is the last candle's volume divided by the average of the previous 20 candles, shown in the read as "0.8× average". Over the last 20 candles, if the volume of up candles is at least 1.3 times that of down candles, the read says buyers carried volume; the reverse says sellers. For a breakout the read wants volume expanding and says so when it is not. Volume is taken from Binance spot only, so it is one venue's view.
Key takeaways
- Volume measures participation, not direction. Always compare it with the same coin's recent average, for example 20 candles.
- A break on above-average volume has more backing; a break on thin volume needs proof afterward.
- Splitting volume by up and down candles gives a rough sense of which side led.
- Crypto volume is noisy: many venues, weekends, events. One candle is a weak witness.
- Volume adjusts trust. It does not replace the close, the level or the invalidation.
Frequently asked questions
Does volume confirm a breakout?
Rising volume on the breaking candle is a point in favor, because more participants were willing to trade at the new price. It does not prove the break will hold. A break on volume near or below average has less backing.
What is relative volume?
It compares the latest candle's volume with the average of the previous candles, for example the last 20. A value of 2.0x means twice the usual volume; 0.5x means half. It makes volume comparable across coins and times.
How do you tell buyer volume from seller volume?
Exchanges do not label each trade as a buyer's or a seller's in the candle data most traders see. A common approximation is to sum volume on up candles versus down candles over a window and see which side dominates.
Why is crypto volume unreliable?
The same coin trades on many venues, spot and futures, and any single exchange shows only a part. Volume also swings with weekends, news and liquidation cascades, so one candle's volume can mislead.
What does a breakout on low volume mean?
It means few participants joined the move. Low-volume breaks fail more often than they hold, so it is wise to wait for a retest or for volume to pick up before trusting the new level.