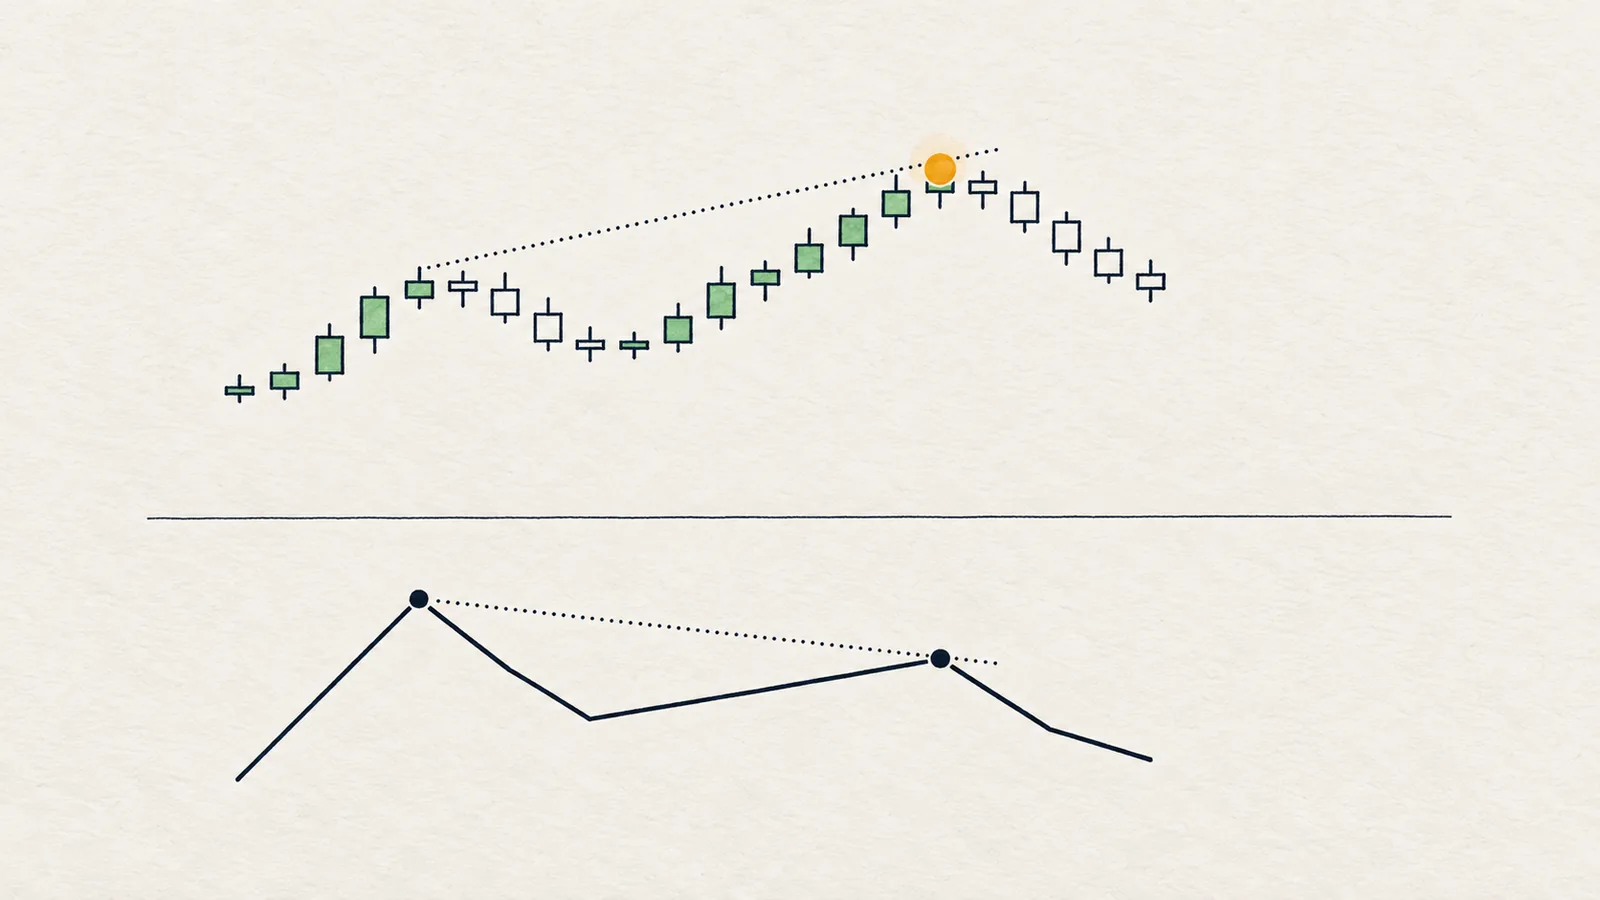
RSI divergence is a disagreement between price and the relative strength index (RSI), a momentum indicator that ranges from 0 to 100. In regular bearish divergence, price makes a higher high while RSI makes a lower high. In regular bullish divergence, price makes a lower low while RSI makes a higher low. It points to fading momentum.
The popular version of this idea, "divergence means reversal", is one of the most expensive misunderstandings in chart reading. This guide explains what RSI measures, how to find a real divergence between two confirmed swings, what it does and does not tell you, and how to use it as a caution flag inside a plan.
What is RSI?
RSI compares the size of recent up closes with the size of recent down closes over a window, 14 candles by default, and scales the result between 0 and 100. When up moves have been larger, RSI rises; when down moves have been larger, it falls.
Traditionally readings above 70 are called overbought and below 30 oversold. Those words mislead. In a strong trend RSI can stay above 70 for a long time while price keeps rising. RSI is better read as a measure of how much push was behind recent moves.
What is regular divergence?
Compare two consecutive swings in price with the RSI at the same two swings:
- Bearish divergence: price makes a higher high, RSI makes a lower high. The newer push up had less momentum behind it than the previous one.
- Bullish divergence: price makes a lower low, RSI makes a higher low. The newer push down had less momentum than the previous one.
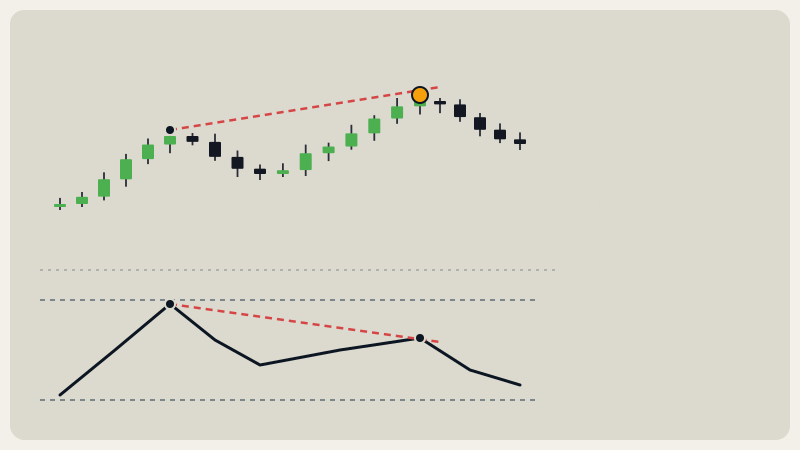
What is happening: price travelled further, but with less force. Buyers (or sellers) are getting the same result with more effort, or a worse result with the same effort. That is exhaustion of the push, not yet a change of direction.
How do you spot divergence on a chart?
Use a short checklist and keep it strict:
- Pick two confirmed swings. Use clear swing highs (or lows) that already have candles on both sides. See market structure for how those are defined. Do not use the unfinished candle at the right edge.
- Compare the price extremes. Is the second high above the first (or the second low below the first)?
- Compare RSI at those two points. Read RSI at the same candles. Is it lower at the second high (or higher at the second low)?
- Check that the swings are close in time. Two swings fifty candles apart tell you little. A fresh divergence, with the second swing recent, is the one that matters.
- Ignore divergence that needs imagination. If you have to squint to find two tops, there is no divergence.
A common mistake is to connect any two RSI peaks that happen to look lower. Always tie the comparison to two price swings that are real structure.
What does divergence tell you, and what doesn't it?
It tells you: the latest push was weaker than the one before. Momentum is slowing.
It does not tell you:
- That price will reverse. In strong trends, divergences pile up and price keeps going. A bullish run can show three bearish divergences before it ends.
- When anything will happen. There is no timer.
- Where a turn would be. Divergence has no price level.
This is why divergence belongs among the conditions of a plan and not in the entry column. It raises caution about continuing in the same direction. It does not point the other way by itself.
How do you use divergence in a plan?
Use it as a reason to be more selective, and wait for structure to confirm a change:
- If price makes a higher high at a level I care about, and RSI makes a lower high (bearish divergence), then I trim my enthusiasm for longs and watch for a break below the last swing low.
- If price then closes below that swing low, then structure has turned, and the divergence becomes useful context for a short idea, with my invalidation above the high.
- If instead price closes beyond the previous high, then the divergence did not matter this time and I move on.
The structure break is the confirmation. See BOS vs CHoCH for how that break is defined. The divergence is the earlier warning that made the break worth watching.
Which timeframe should you check for divergence?
Divergence on a higher timeframe carries more weight because each swing represents more trading. A bearish divergence on 1D, with two swings weeks apart, is a heavier fact than one on 15m, where swings appear every hour. A practical approach is to look for divergence on the timeframe you plan on, and then ask whether the next higher one agrees or disagrees. If the 4H chart shows bearish divergence while the 1D chart is in a clean, strong uptrend, the divergence is more likely a pause inside the larger move.
Context decides too. Divergence at a level where you already expect a reaction, such as a prior high or an equal high, carries more meaning than the same pattern in open space. It does not replace the level. It is an extra reason to look at the level carefully.
When does divergence mislead?
- Strong trends. Momentum indicators flatten in persistent moves. Divergence in a strong trend is more often a pause.
- Low timeframes. On 5-minute charts divergences appear constantly and mean little.
- No level. A divergence in the middle of nowhere is just an observation.
- Cherry-picked swings. Pick the start point after the fact and you can find a divergence anywhere.
- Waiting for it before acting. Not every turn is preceded by divergence, and most divergences are not followed by a turn.
Honest note: RSI divergence is a weak and noisy tool on its own. It is common, often early, and frequently followed by more of the same move. Its value is as a modest weight on the scale, a reason to be more careful about chasing a move, and not as a call to fade it.
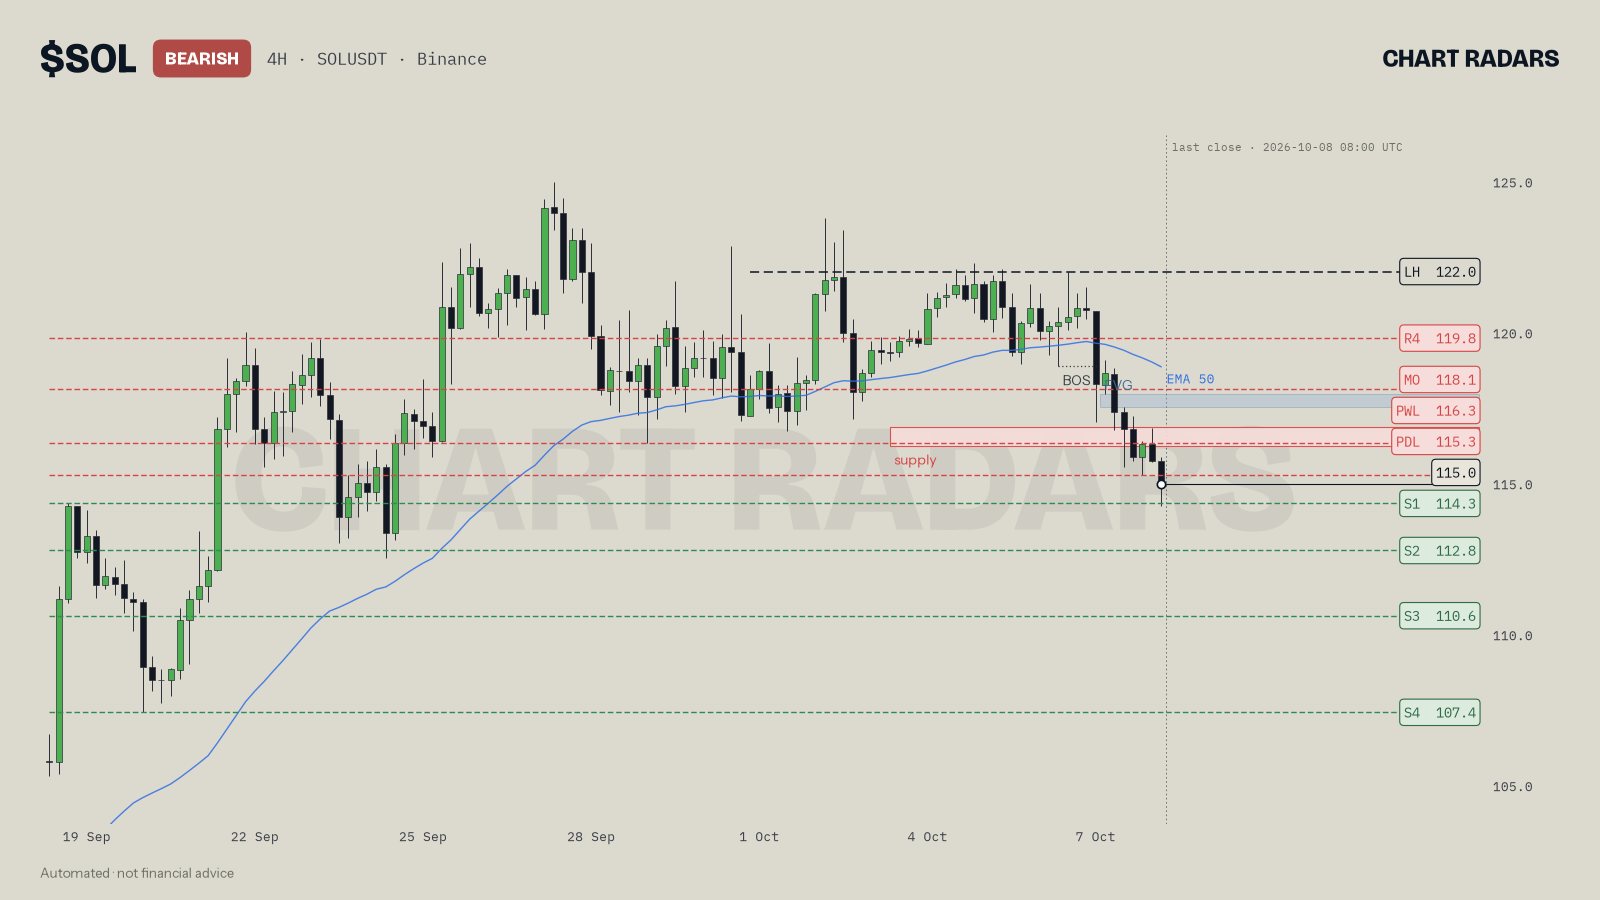
On SOL 4H, close of 8 Oct 2026, the read flags a bullish RSI divergence on 4H: price went lower but momentum did not. The chart itself does not draw RSI, so the divergence is only in the read's caution line. What the read does with it is revealing. It stays bearish (4H and 1D structure bearish, price pinned below the 122.0 lower high), and it only uses the divergence to be more selective with shorts and to prefer a pullback into a supply zone, plus a 15m shift down, before acting. A bullish divergence inside a bearish read gets treated as friction, not as a reason to flip.
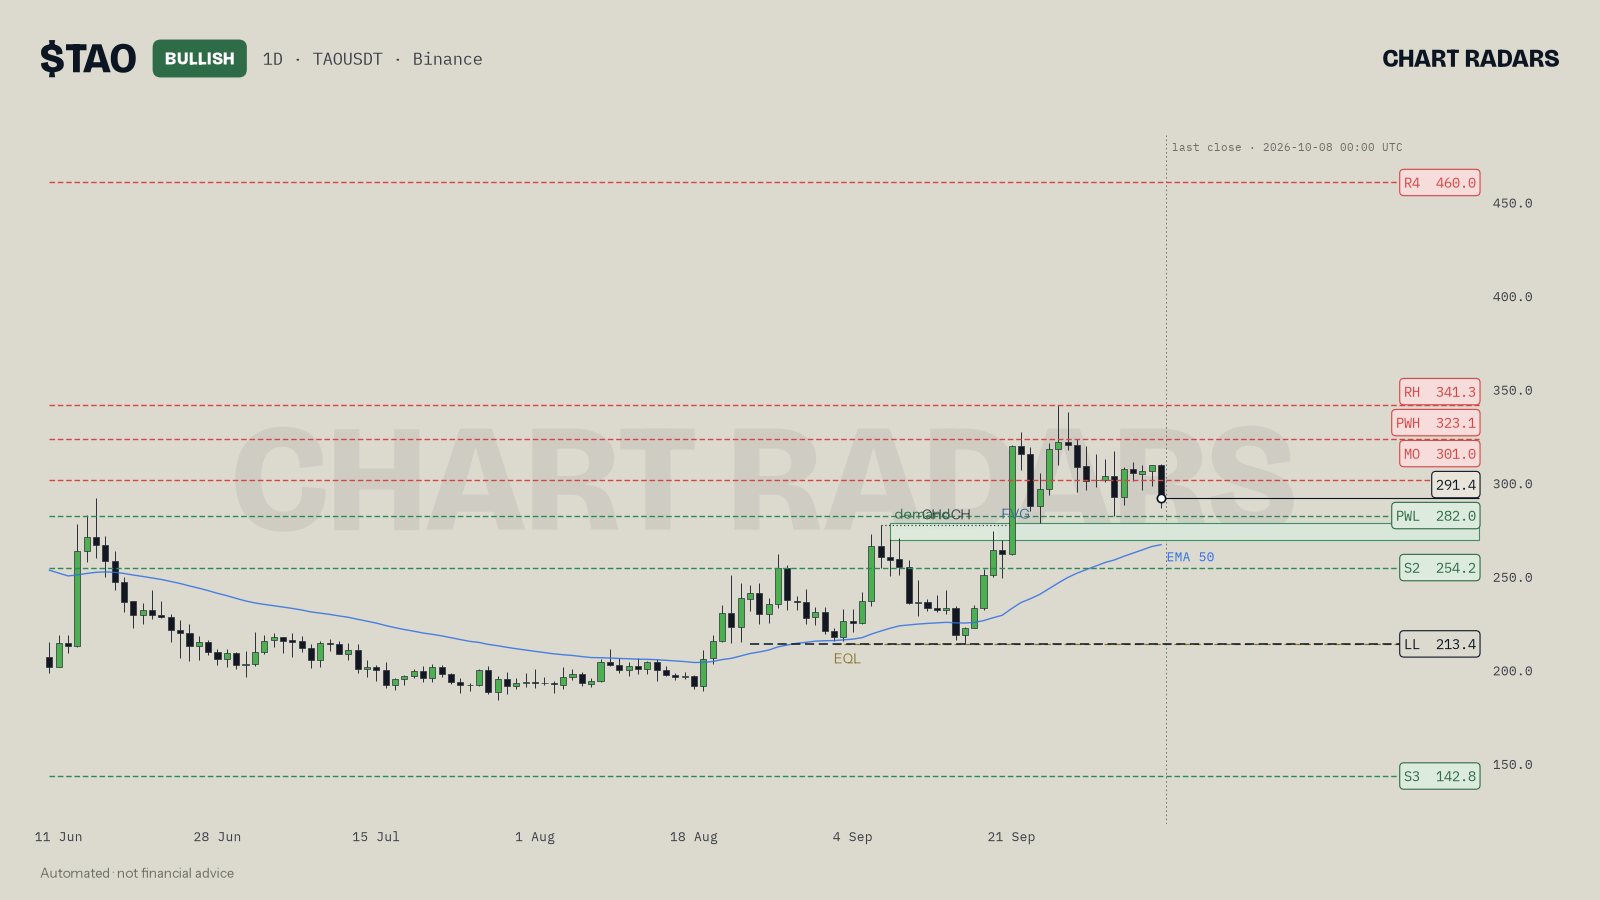
On TAO 1D, close of 8 Oct 2026, the mirror case: the read stays bullish with price above the last swing low at 213.4, and flags that 1D RSI printed a lower high while price made a higher high (bearish divergence), plus TAO lagging BTC at the highs. Again the divergence changes the tone (more selective on long entries, wait for the zone and confirmation), not the direction of the read.
In Chart Radars: RSI uses 14 candles. A divergence is checked only between the last two confirmed swings, and only if the last swing is within the last 15 candles. Higher price high with a lower RSI high is bearish; lower price low with a higher RSI low is bullish. The read treats it as momentum fading, not as a reversal, and uses it to be more selective.
Key takeaways
- RSI measures the push behind recent moves on a 0 to 100 scale. Overbought and oversold are not sell and buy.
- Regular divergence is price making a new extreme while RSI does not. It means fading momentum.
- Compare two confirmed, recent swings. Do not connect random peaks.
- Divergence is not a reversal. It belongs in the conditions of a plan, with a structure break as confirmation.
- In strong trends, divergence repeats and fails. Use it to be more careful, not to fade a move.
Frequently asked questions
What is RSI divergence?
It is a disagreement between price and the RSI indicator. In bearish divergence, price makes a higher high while RSI makes a lower high. In bullish divergence, price makes a lower low while RSI makes a higher low. It suggests momentum is weakening.
Does RSI divergence mean a reversal is coming?
No. It means the push behind the latest move was weaker than the one before. Price can still continue, move sideways or reverse, and in strong trends divergence can appear several times before anything turns.
What RSI setting is best for divergence?
The standard 14 periods is the common default. Shorter periods produce more divergences and more noise; longer ones produce fewer. Consistency matters more than the exact number.
What is the difference between regular and hidden divergence?
Regular divergence (price and RSI disagree at new extremes) hints at fading momentum against the trend. Hidden divergence is a different idea used to look for trend continuation. This guide covers regular divergence only.
How do you confirm an RSI divergence?
Wait for a structure break against the prior trend or a close beyond a key swing in the opposite direction. Divergence alone only says the momentum is weaker; a structural shift says control may have changed.