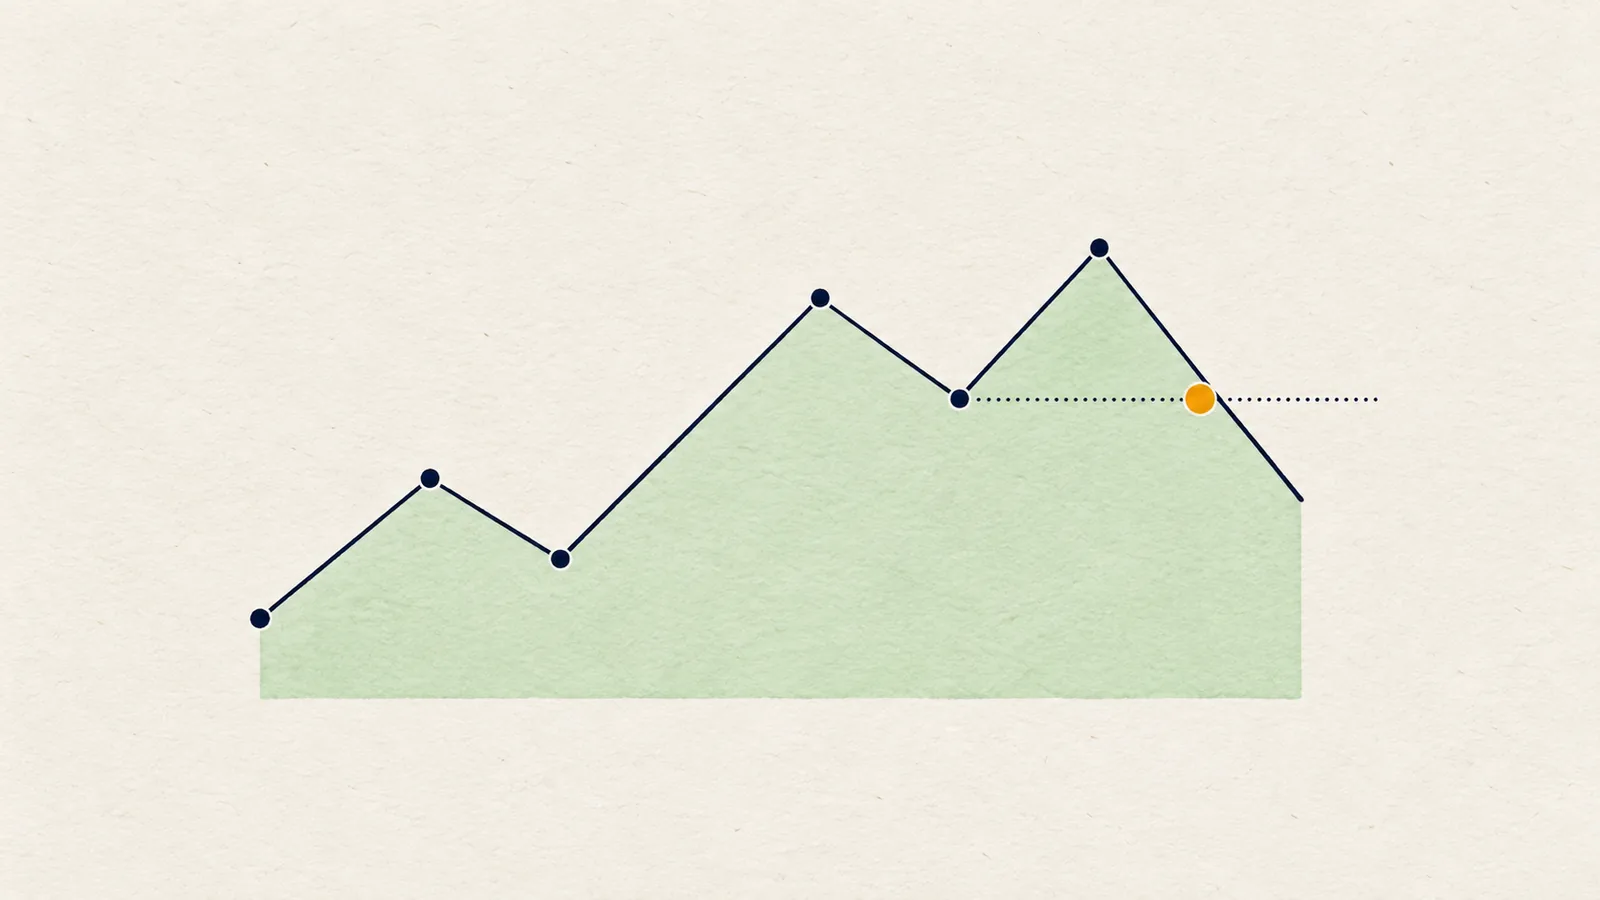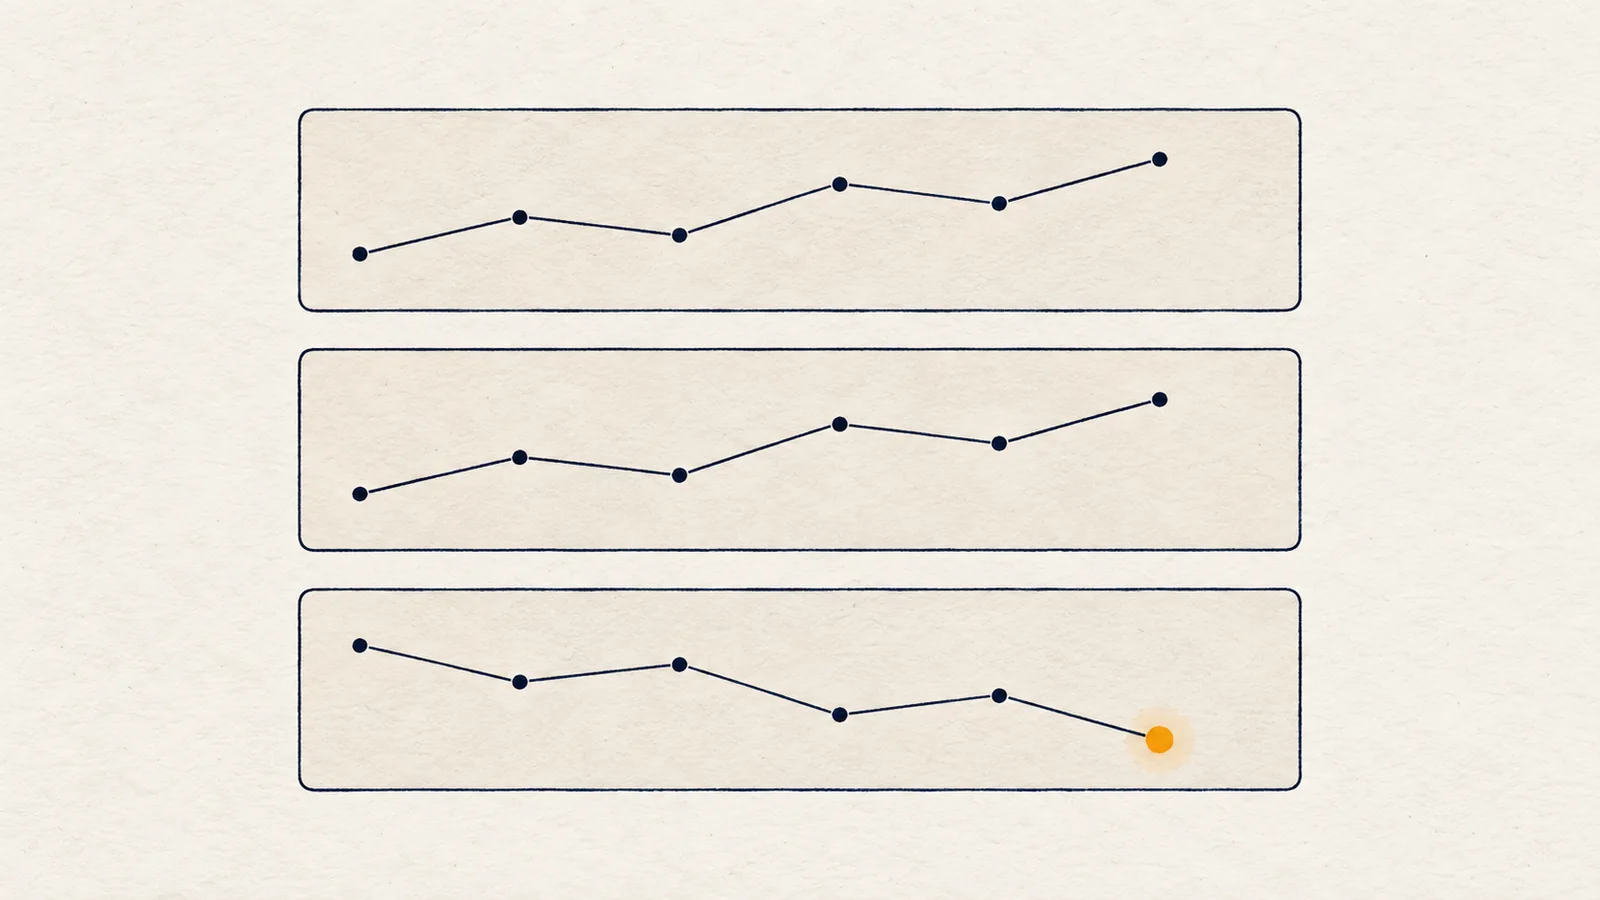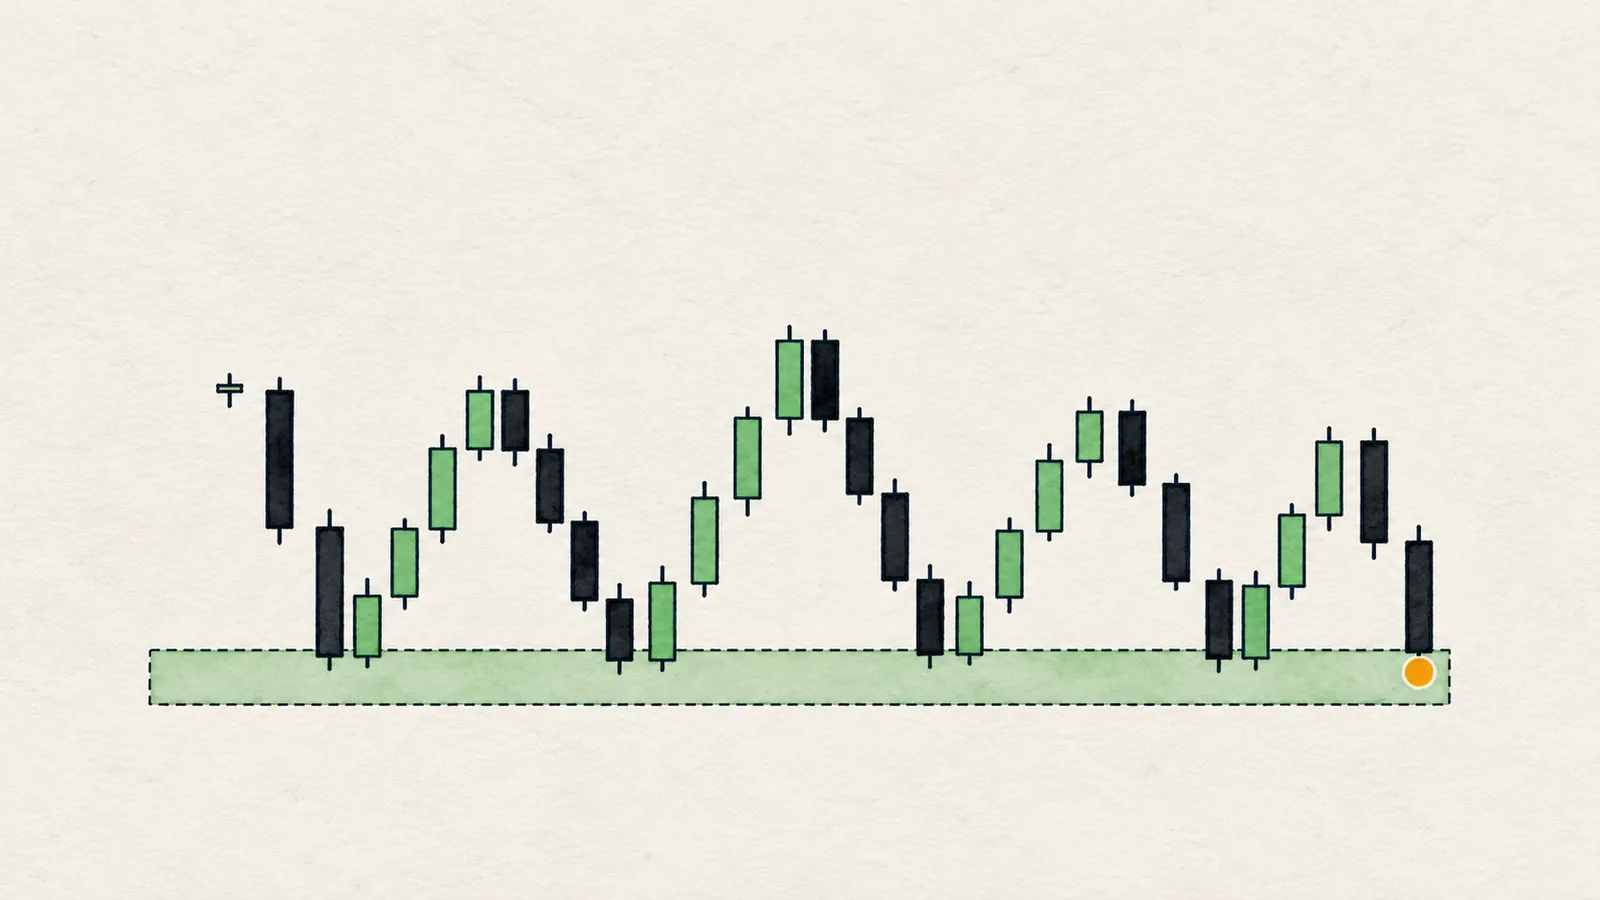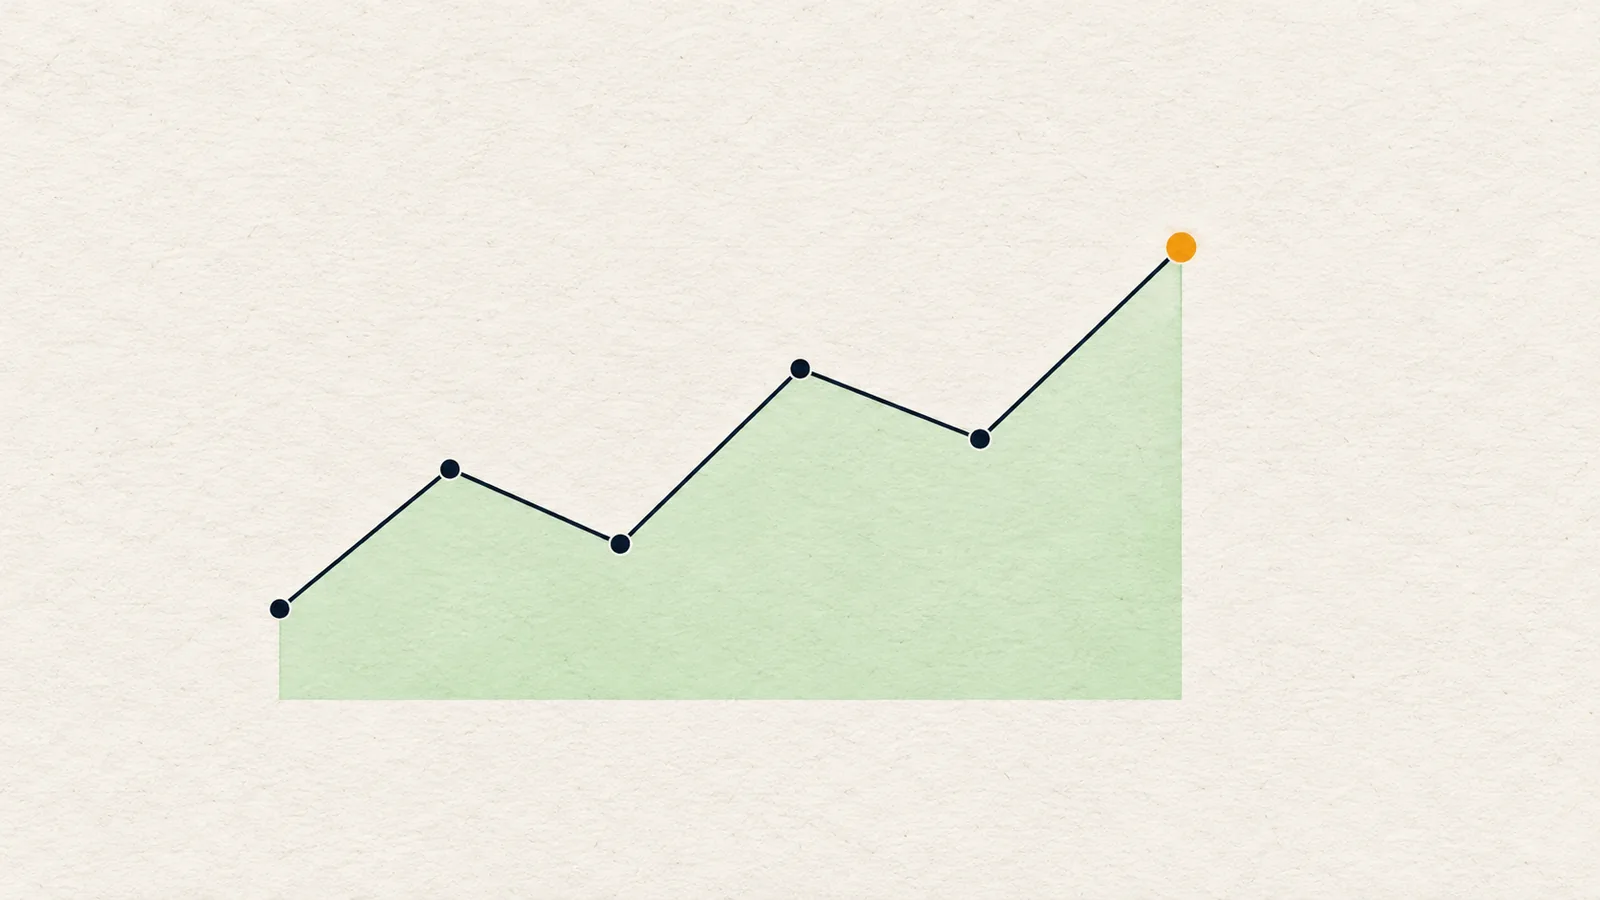
Market structure is the sequence of swing highs and swing lows that price leaves behind. When each new swing high and swing low sits higher than the previous one, structure is bullish; when each sits lower, it is bearish; when they overlap or disagree, the market is ranging. Traders read it to see which side currently has control.
If you only learn one chart-reading skill, make it this one. Support, resistance, fair value gaps and funding all mean something different depending on whether the market is stepping up, stepping down or going sideways. This guide builds the skill from the ground up: what a swing is, how to label it, how to tell trend from range, and how to turn the reading into if/then plans instead of predictions.
What is a swing high and a swing low?
A swing high is a local peak: a candle whose high is above the highs of the candles around it. A swing low is the mirror image, a local trough. They are the turning points of price, the places where buyers or sellers briefly ran out of push.
The usual way to define them is with a lookback of a few candles on each side. For example, "a candle whose high is higher than the three candles before it and the three candles after it". Change that number and you change how many swings you see. Fewer candles give more swings and more noise. More candles give fewer swings and a cleaner but slower picture.
One consequence is easy to miss: a swing point can only be confirmed after the fact. With a three-candle rule, you do not know a peak was a swing high until three more candles have closed below it. Structure always lags a little, and that is the price of not guessing.
How do HH, HL, LH and LL work?
Once you have swings, you compare each new one with the previous swing of the same kind:
- HH (higher high): a swing high above the previous swing high.
- HL (higher low): a swing low above the previous swing low.
- LH (lower high): a swing high below the previous swing high.
- LL (lower low): a swing low below the previous swing low.
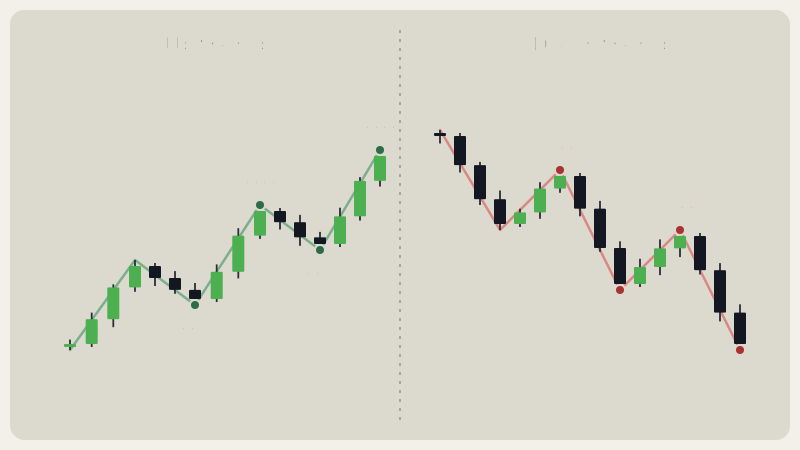
An uptrend is HH plus HL: price pushes to a new high, pulls back to a low that is still higher than the last one, and repeats. A downtrend is LH plus LL. The pairing matters. A new HH with a lower low is not an uptrend, it is a market whose swings are widening in both directions, which usually means conflict.
How do you read market structure step by step?
- Pick one timeframe and zoom out. Look at the last 100 to 200 candles so you see the whole swing sequence, not just today.
- Mark the confirmed swing highs and lows. Only mark peaks and troughs that already have candles on both sides. Skip the one forming right now.
- Label the last two highs. Is the newer one higher (HH) or lower (LH)?
- Label the last two lows. Is the newer one higher (HL) or lower (LL)?
- Combine them. HH + HL is bullish. LH + LL is bearish. Any other pair, such as HH + LL or LH + HL, is mixed.
- Find the protecting swing. In an uptrend it is the most recent HL, in a downtrend the most recent LH. This is the level the story depends on.
- Write one sentence. "Structure is bearish while 122 holds as the lower high." If you cannot write it, you do not have a read yet.
Step 6 is the one beginners skip, and it is the most useful. Structure is not only a label, it also tells you where the label stops being true.
Tip: Draw the protecting swing as a horizontal line and label it with what it is. A line called "last HL" is a plan. A line called "support" is a guess.
How do you tell a trend from a range?
Swings alone leave gaps. Price can print a higher high and a higher low inside a tight chop and still go nowhere. Many traders add two checks so a trend label has to be earned:
- Distance from a baseline. Is price clearly on one side of a moving average, or hugging it? Hugging means no directional commitment.
- Slope of that baseline. Is the moving average itself tilting the same way as the swings?
ATR (average true range, a candle's typical size over a recent window) is a handy yardstick for "clearly". Measuring distance in ATR instead of dollars makes the check work on a coin trading at 0.25 and one trading at 80000.
A range is not a failure to find a trend. It is a real state: neither side has shown control, and the most valuable information is where the edges are. In a range, the middle of the box is where plans have the worst reward for the risk.
Why read structure before anything else?
Three reasons.
It sets direction for everything else. A pullback into a demand zone means something different in a bullish structure than in a bearish one. A sweep of lows followed by a reclaim is more interesting inside an uptrend than in the middle of a downtrend.
It gives you an invalidation level. The protecting swing is a concrete price. If it breaks on a close, the idea is wrong. Without that, it is easy to hold a bad idea for days.
It keeps you honest about uncertainty. Calling a range a range stops you from forcing a trend story onto noise.
How do you use market structure in a plan?
Structure should produce conditional statements, not forecasts. A useful template:
- If structure is bearish and price stays below the last lower high, then I look for a rally into a zone below that high, and I treat a close above the high as the idea being wrong.
- If structure is bullish and price holds the last higher low, then I look for pullbacks toward that low, and a close below it cancels the plan.
- If structure is a range, then I only care about the edges: a break and close outside, or a rejection back inside.
The same chart can support two plans, one on each side of a level. That is fine. What matters is that each plan comes with the price that kills it.
What does it look like on a real chart?
A bearish structure: SOL 4H, 8 Oct 2026
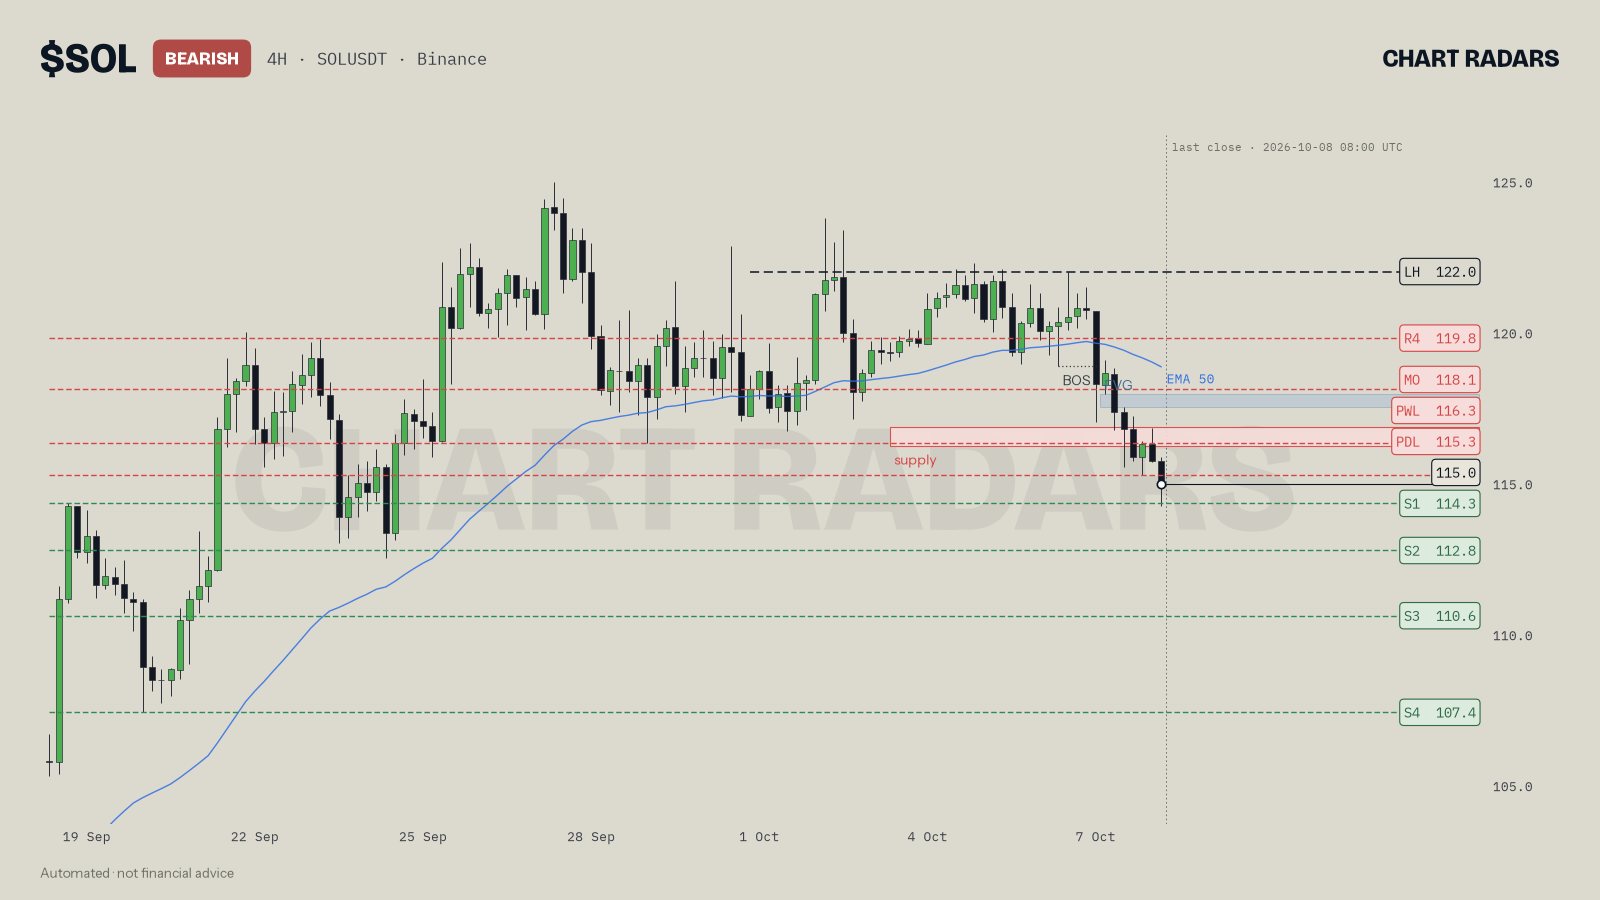
On this chart the last two swing highs are a lower high (LH) and the last two swing lows are a lower low (LL), so structure reads bearish. The dashed black line at 122.0 marks the lower high that protects the idea. Price is at 115.0, below the daily open (116.3), the weekly open (121.6) and the monthly open (118.1). The last structure break is marked BOS, a close below 118.88. Notice what the read does not say: the weekly structure is still bullish, so the 4H bearish reading is a lower-timeframe view with a bigger picture pulling the other way. A 4H close above 122.0 would end the bearish structure.
A bullish structure: BNB 1D, 8 Oct 2026
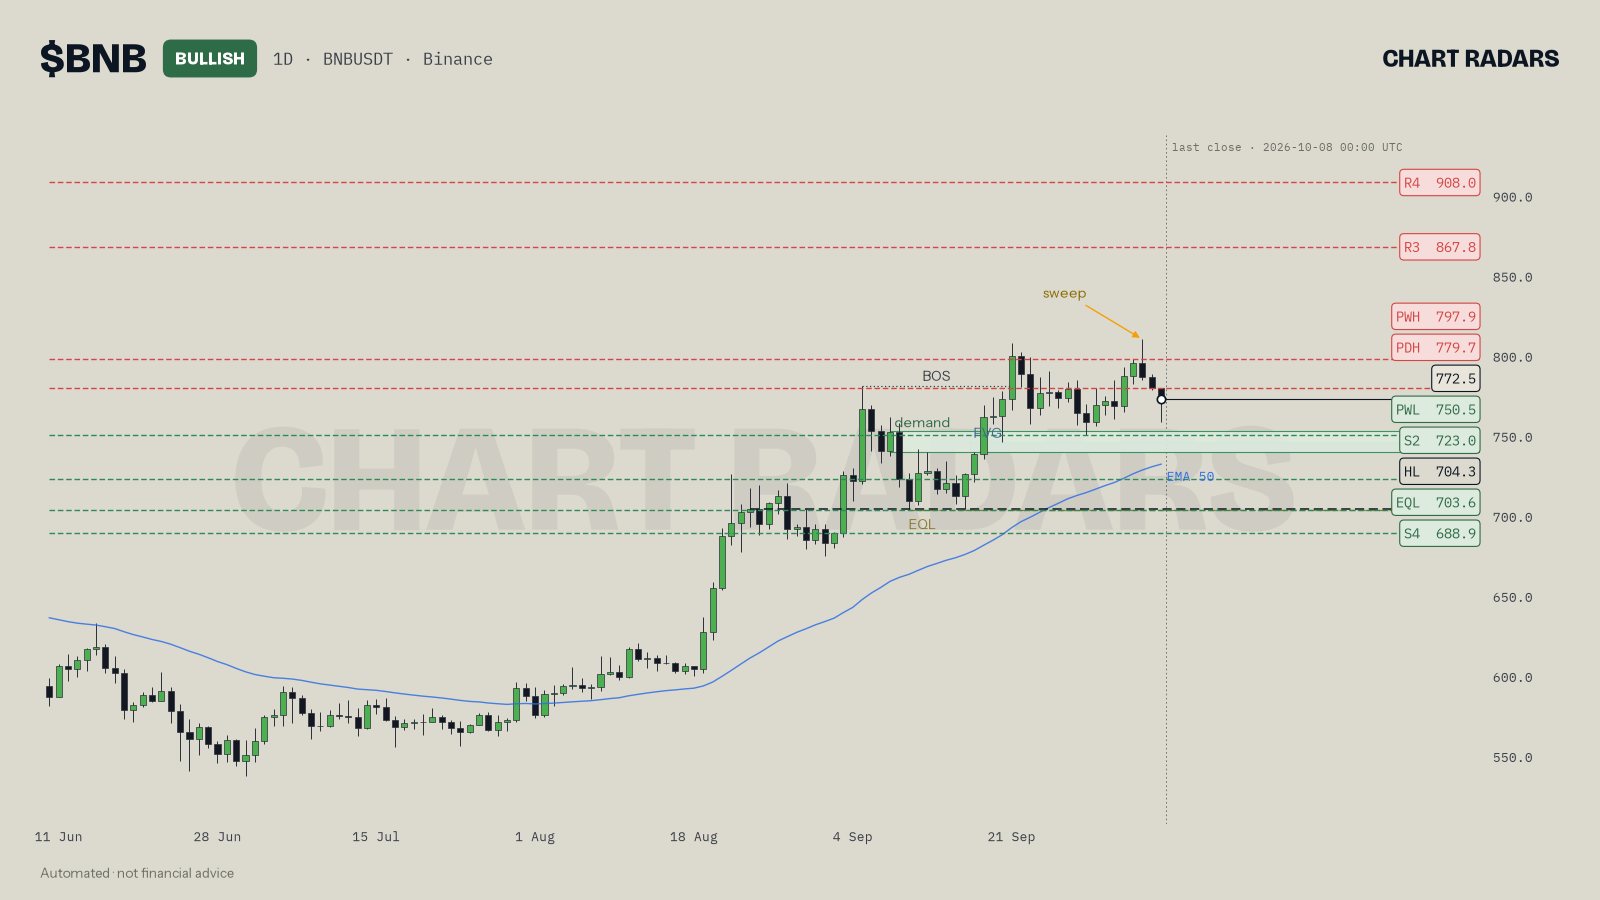
Here the last two highs are HH and the last two lows are HL, and the chart label is BULLISH. The protecting swing is the higher low at 704.3, with price at 772.5. The chart also shows a sweep above the recent highs and a demand zone that overlaps a fair value gap lower down. The read adds a caution: the pair is printing higher highs against USDT but not against BTC, which it treats as a sign the move may be tiring. A daily close below 704.3 would turn the structure bearish.
Two charts, same method: label the last two highs and lows, find the swing that protects the idea, write the sentence.
In Chart Radars: A swing high or low is a candle with three lower highs (or three higher lows) on each side, so it is confirmed three candles late. The last two swing highs give HH or LH, and the last two swing lows give HL or LL. A trend read needs three things at once: structure (HH+HL bullish or LH+LL bearish), a close at least 0.3 ATR from the 50 EMA, and an EMA that has sloped the same way over the last 10 candles. If any one disagrees, the read is range. The label in the chart header is the overall bias across timeframes: BULLISH or BEARISH only when more timeframes lean that way than the other, otherwise RANGE. The protecting swing (HL in a bullish read, LH in a bearish one) sits at least 1 ATR and at most 6 ATR from entry, and a close beyond it voids the read.
When does market structure mislead?
On low timeframes. On a 15-minute chart, swings come constantly and most of them are noise. A structure read on a very low timeframe, without the higher timeframes behind it, is fragile. See multi-timeframe analysis for how to stack them.
Right after a news candle. One violent candle can create a swing that looks meaningful but only reflects a single burst of orders.
When you read it too late. Because swings confirm with a delay, structure describes what has happened, not what is next. A trend can already be mature by the time the label flips.
When you hold the label too tightly. A bullish structure with a very large pullback is still bullish until the protecting swing breaks. Equally, the protecting swing breaking does not mean a new trend has started. It means the old idea is void. What replaces it is a separate question, and the answer begins with a break of structure or change of character.
Honest note: Structure is a description, not a forecast. In the backtests we have run on our own engine, the trend label on its own did not show a strong directional edge, which is why Chart Radars reads structure as a map of conditions rather than a prediction of direction. Use it to decide where you would be wrong, not to decide where price must go.
How does structure connect to levels?
Swing points are also where most horizontal levels come from. Several swing highs at similar prices form a resistance area, and several swing lows form support. That is why a protecting swing is both a structure marker and a level. For how those clusters are drawn and tested, see support and resistance.
Key takeaways
- Structure is the sequence of confirmed swing highs and lows. HH + HL is bullish, LH + LL is bearish, anything mixed is a range.
- A swing can only be confirmed after later candles close, so structure always lags a little.
- Always identify the protecting swing: it is the price that makes the idea wrong.
- A range is a real state. In the middle of it, plans have poor reward for the risk; the edges matter.
- Turn structure into if/then plans with an invalidation price, never into a forecast.
Frequently asked questions
What is market structure in trading?
Market structure is the sequence of swing highs and swing lows on a chart. Higher highs with higher lows describe an uptrend, lower highs with lower lows describe a downtrend, and anything mixed is a range.
What is the difference between HH, HL, LH and LL?
HH is a higher high, HL a higher low, LH a lower high and LL a lower low. Each compares a new swing point with the previous one of the same kind.
How do you identify a swing high and a swing low?
A swing high is a candle whose high is above the highs of the candles on both sides of it. A swing low is the mirror image. The rule only confirms after those later candles have closed.
How do you know if the market is trending or ranging?
Check whether the swings step in one direction and whether price is holding on that side of a moving average. If swings overlap or the signs disagree, treat it as a range.
Why should you read market structure before using indicators?
Structure shows who currently controls price and where the idea fails. Indicators describe momentum inside that picture, so they are easier to judge once structure is clear.