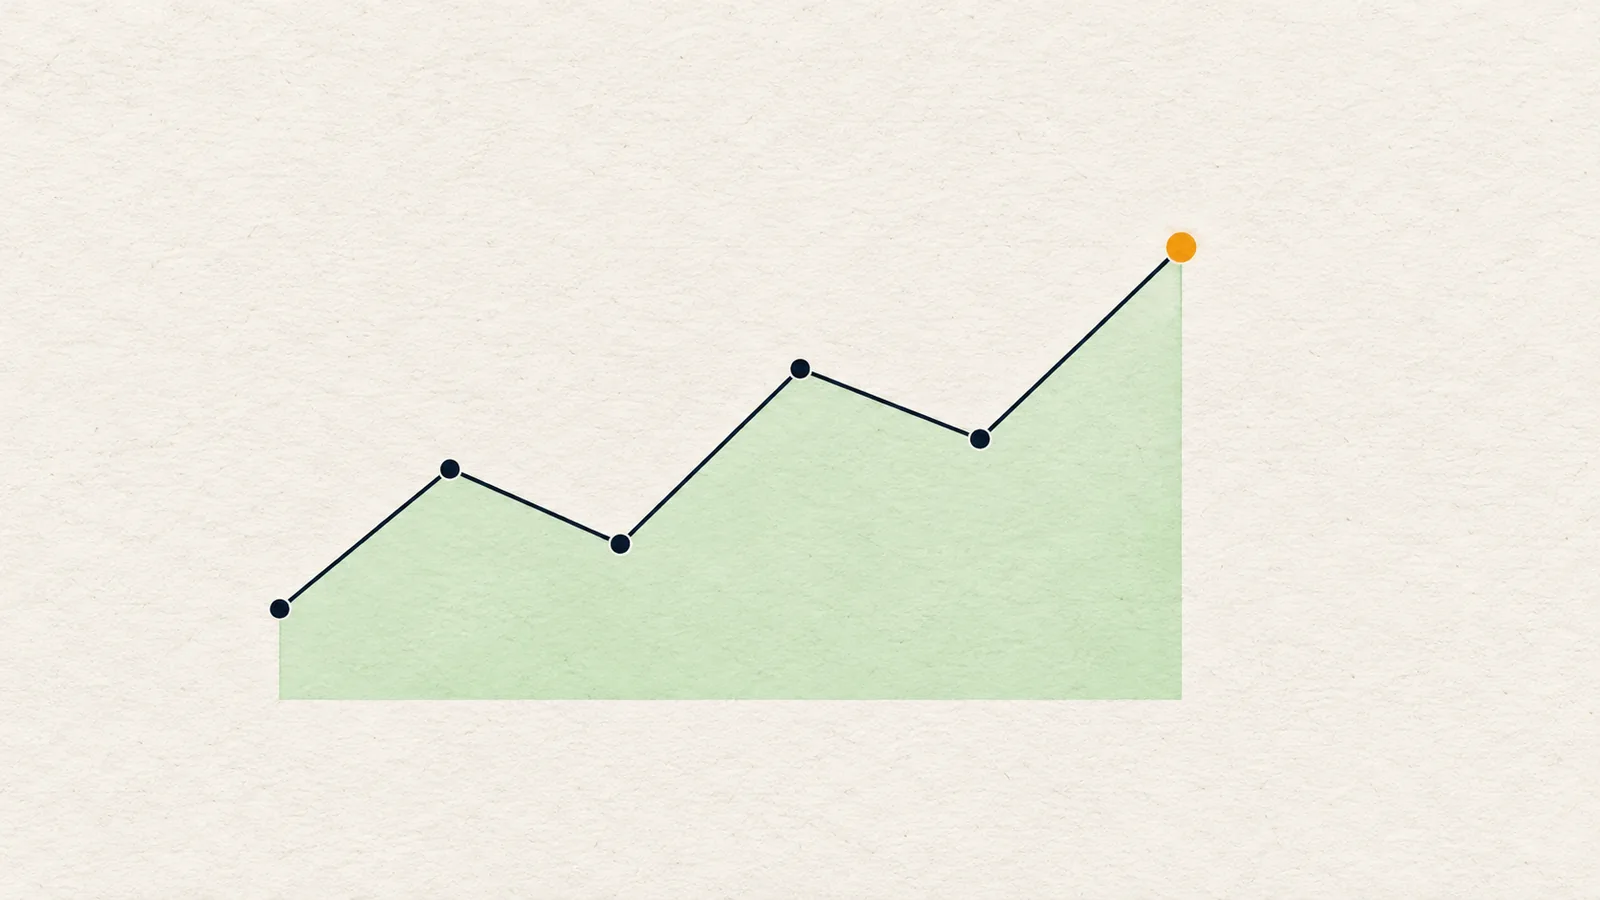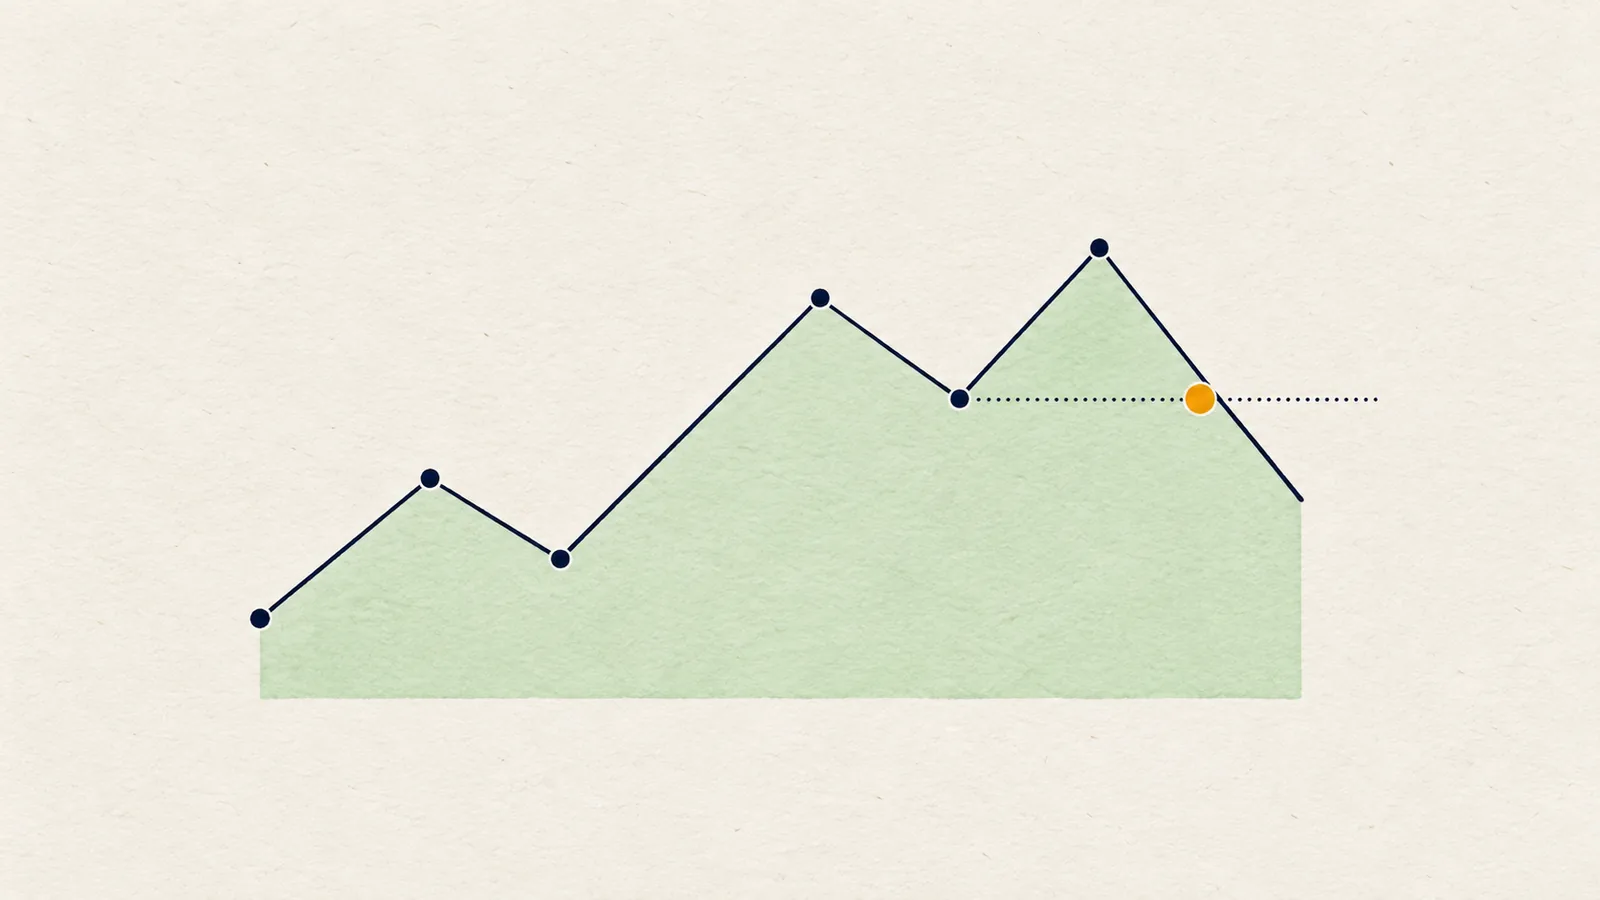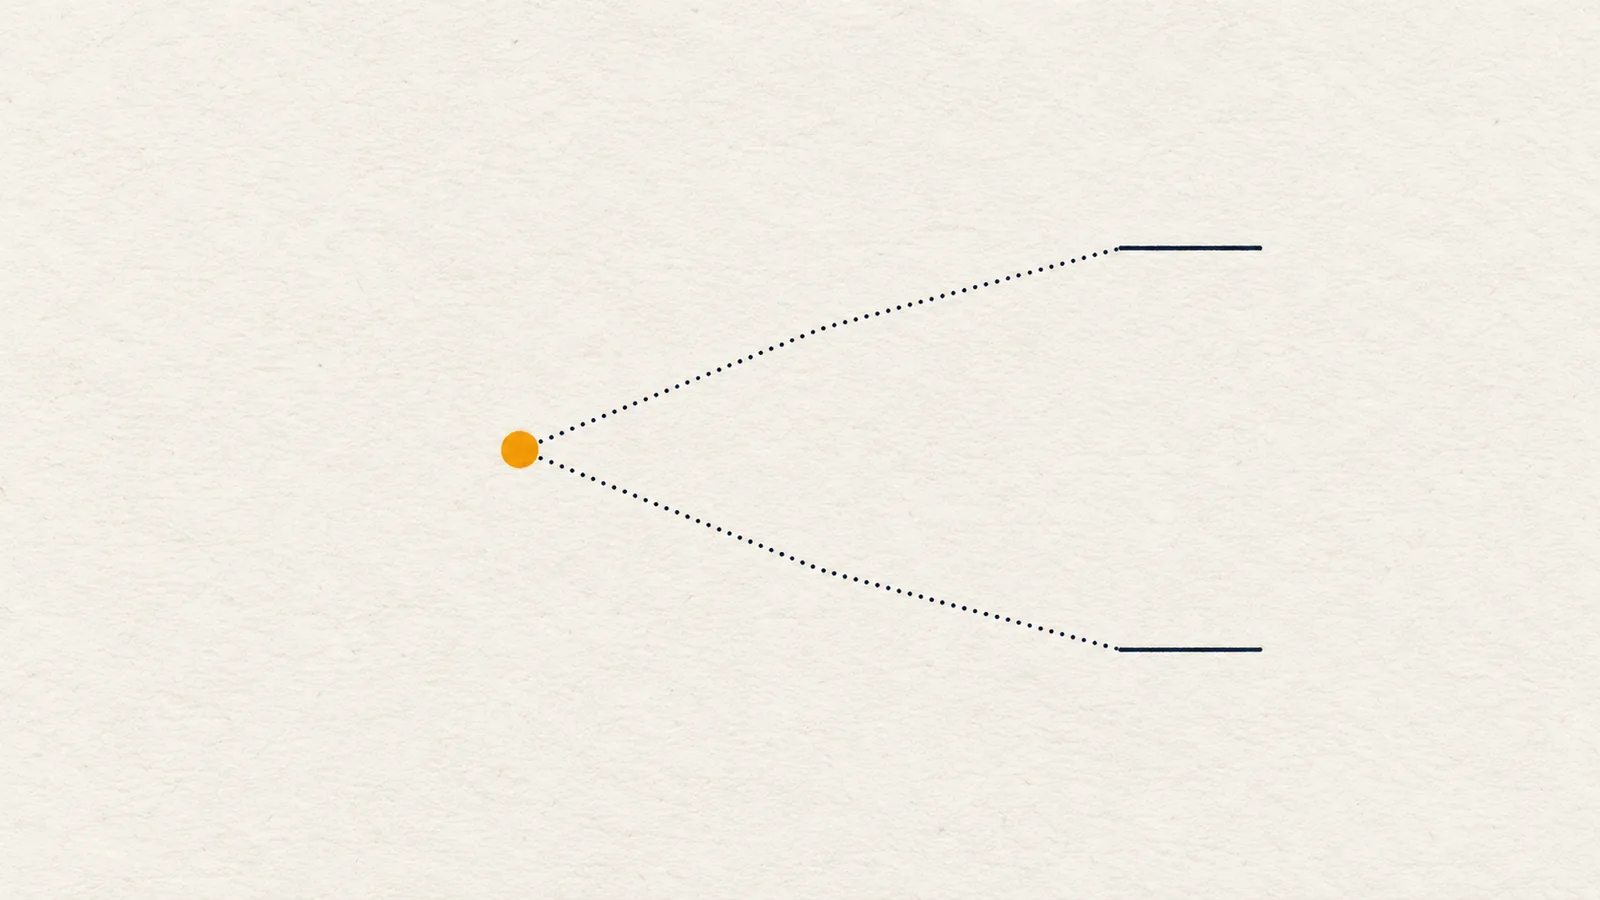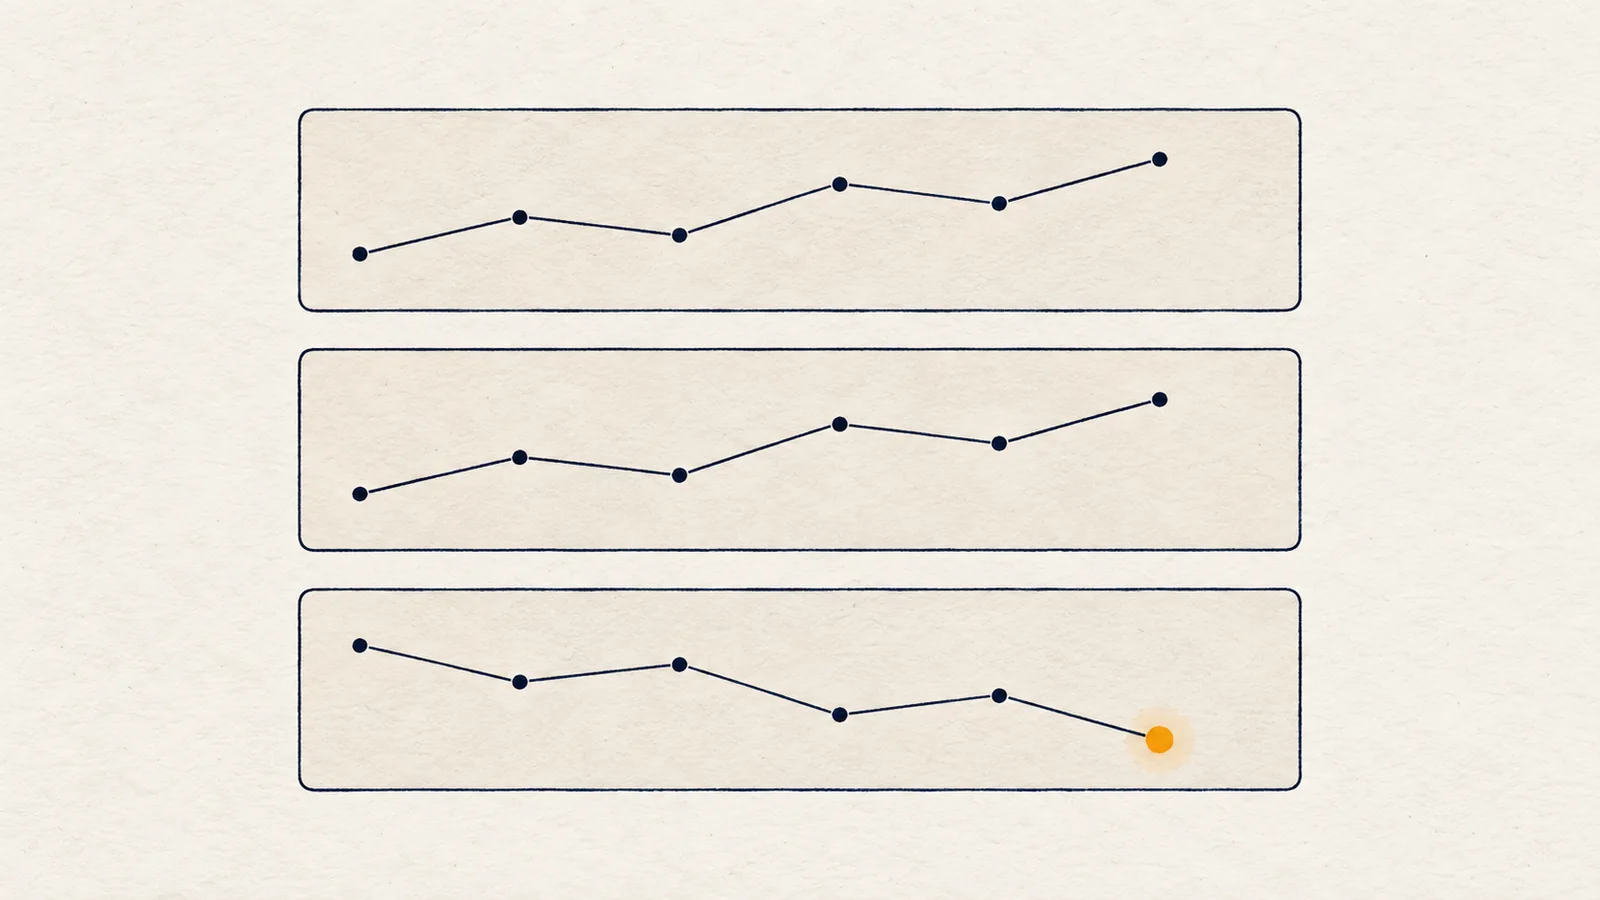
Multi timeframe analysis means reading the same market on several chart timeframes, usually from the largest to the smallest, so the bigger picture frames the smaller one. A typical crypto stack is weekly, daily, 4-hour and 1-hour. When the timeframes agree, direction is clearer. When they disagree, the market is more likely pulling back or ranging.
The idea sounds obvious, but most beginners still trade from a single chart and are surprised when a clean-looking 15-minute breakout runs into a daily wall. This guide explains what each timeframe is for, how to read them from the top down, how to treat alignment and conflict, and how to use a lower timeframe for confirmation without letting it override the big picture.
What is multi timeframe analysis?
Price is fractal: the same swings, trends and ranges show up on every timeframe. That is useful and dangerous. Useful, because the same tools work everywhere. Dangerous, because a strong trend on a 15-minute chart can be a small pullback inside a downtrend on the daily, and you cannot see that without zooming out.
Multi timeframe analysis fixes this by giving every chart a rank. The higher timeframe is the context. The lower timeframe is the detail. You never judge the detail without the context.
What does each timeframe tell you?
A rough division of labour for crypto:
- 1W (weekly): the backdrop. Is the market in a long-term uptrend, downtrend or range? Which large swings and levels matter?
- 1D (daily): the trend. The main direction you favour and the swing that protects it.
- 4H: the setup. Where is price relative to zones and levels, and is it pulling back or pushing?
- 1H: the timing. Lower-timeframe structure shifts that confirm or deny an idea.
Two rules keep the stack useful. First, keep each step roughly four to six times the one below (1W to 1D is seven, 1D to 4H is six, 4H to 1H is four). Second, do not use more than three or four. A sixth chart does not add information, it adds ways to find a story you already want.
How do you do top-down analysis step by step?
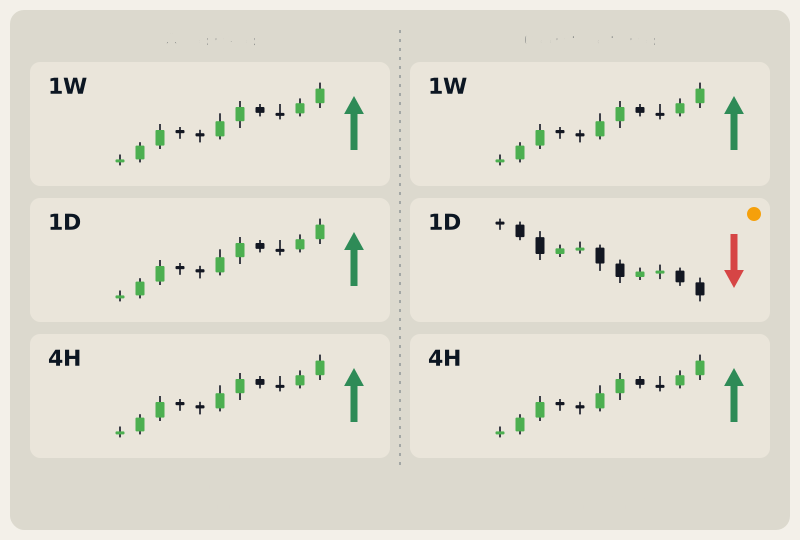
- Start on the weekly. Label market structure as bullish, bearish or range. Mark the one swing that protects it.
- Move to the daily. Same labels. Does it agree with the weekly?
- Move to the 4H. Same labels again. This is usually where the plan lives.
- Write the stack in one line. For example: "1W bullish, 1D bullish, 4H bearish." The line is the analysis.
- Decide the plan type. Aligned stack: look for continuation setups on pullbacks. Conflicting stack: treat the lower timeframe as a pullback or a range and be selective.
- Drop to the 1H (or 15m) only for confirmation. Look for a structure shift in your intended direction, not for a new idea.
The point of step 4 is discipline. If you cannot write the stack in one line, you are looking at the wrong charts or you have not labelled them yet.
What is the difference between alignment and conflict?
Alignment means the timeframes you chose share a direction. A bullish weekly, daily and 4H is the cleanest backdrop: pullbacks into support are more likely to be buyable and breaks upward have room to run. This is the situation where a plan with the trend is easiest to hold.
Conflict means they disagree. Common patterns:
- Higher timeframe bullish, lower timeframe bearish. Often a pullback inside an uptrend. The question is whether the lower timeframe is correcting into a higher-timeframe level or breaking down for real.
- Higher timeframe bearish, lower timeframe bullish. Often a relief rally inside a downtrend.
- Everything mixed. No side has control. This is a range, and the honest label is range.
Conflict is not a failure of the method. It is the method telling you something: the market is not committed. The cleanest response to a conflicting stack is to wait for the edges of the range, or for the lower timeframe to realign with the higher one.
Why does a conflicting stack mean "range"?
Think about what the labels say. A bullish daily means buyers have been in control over days. A bearish 4H means sellers have been in control over hours. Both can be true at once, and the fact that neither has overpowered the other is exactly what a range is. Price oscillates between the two views until one of them breaks.
That is why a conflicting stack makes poor entries in the middle and better ones at the edges: at an edge, a break or a rejection resolves the argument. In the middle, you are paying for a coin flip.
How do you use a lower timeframe for confirmation?
A lower timeframe is for timing, not for direction. Once the higher timeframe plan says "I want to buy a pullback into this zone", the lower timeframe answers "has the pullback actually stopped?". Typical confirmations:
- A change of character on the lower timeframe in the direction of your plan.
- A sweep of nearby lows followed by a close back inside.
- A clear reaction candle at the zone, followed by a higher low.
None of these makes the trade right. They only show that the market has begun to respond where you said it might. If the lower timeframe never confirms, you pass. Missing a move costs nothing. Taking an unconfirmed one costs money.
Tip: Write down the lower timeframe condition before price reaches the zone. A rule you invented while looking at a candle is a rationalisation.
How do you use the stack in a plan?
Turn the stack into conditional sentences:
- Aligned bullish: "If price pulls back into the 4H zone and a 1H structure shift appears, I look for continuation; a 4H close below the protecting low cancels it."
- Conflicting (higher bullish, lower bearish): "If price closes above the lower-timeframe lower high, the stack realigns and I look for the higher-timeframe direction; if it closes below the lower-timeframe low, the pullback is deeper than expected and I wait."
- Fully mixed range: "I only act at the edges: a close beyond them, or a rejection back inside."
Each plan names a price that cancels it. That is the part scenario planning is built around.
What does multi timeframe look like on real charts?
A conflicting stack: BTC 4H, 8 Oct 2026
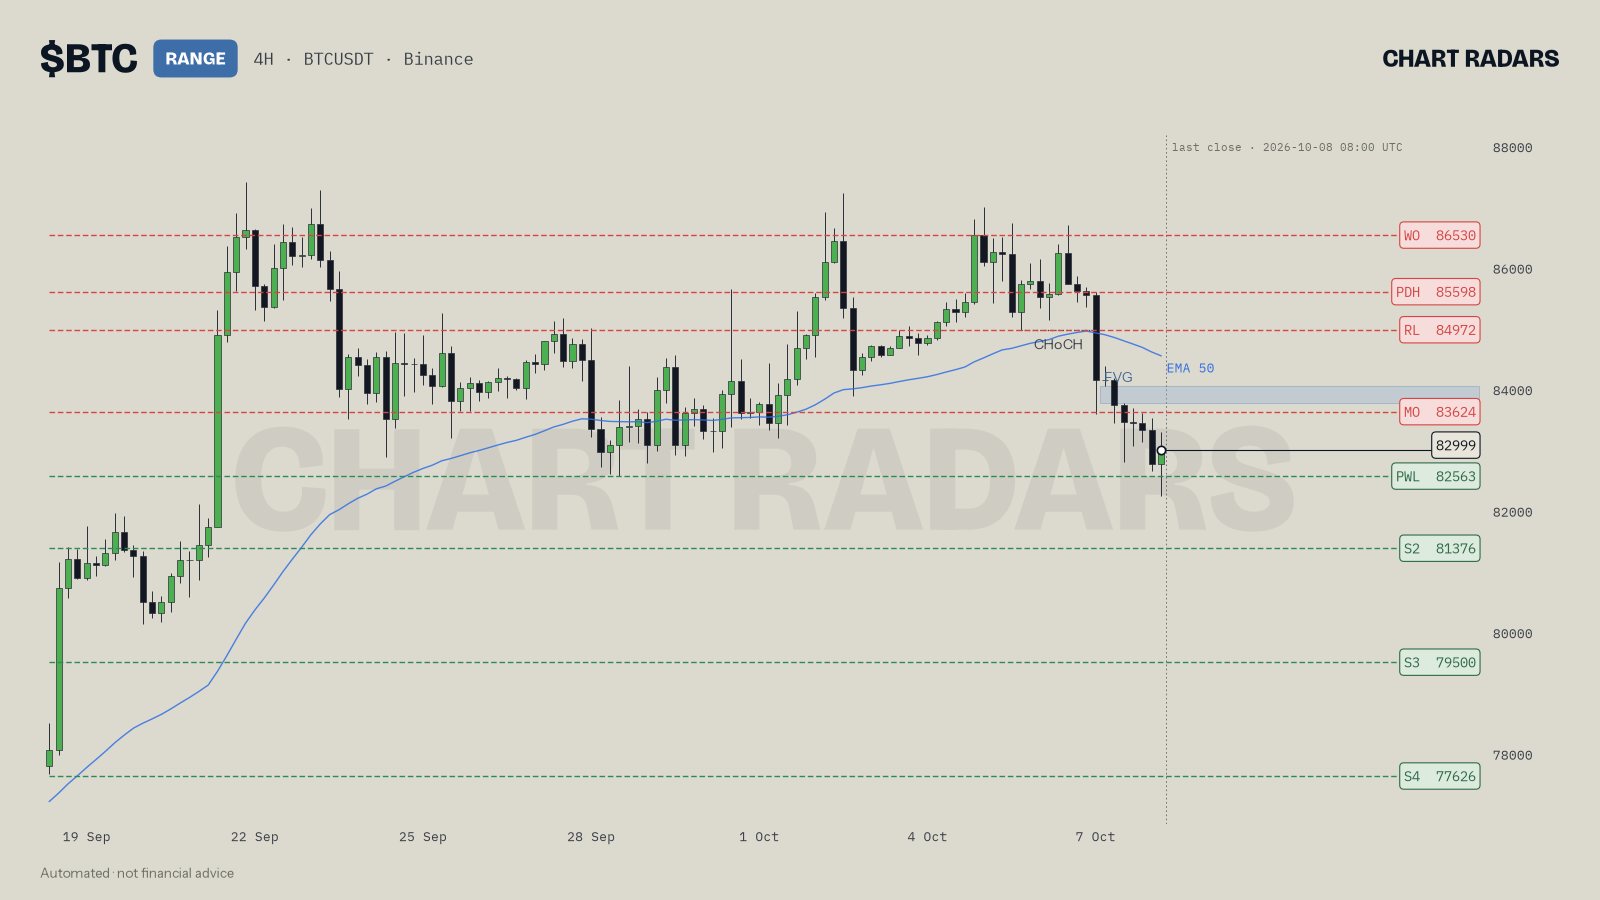
On this chart the 4H trend is bearish, while the 1D and 1W trends are both bullish, so the overall bias is neutral and the 4H chart is labelled RANGE. The read says it plainly: there is no edge in the middle of the 82563 to 83624 range, so it would only act at the edges. A long after a sweep and reclaim of the 82563 prior-week low, or a short after a rejection at the 83624 monthly open. That is what a conflicting stack looks like in practice: an instruction to wait, not a direction.
A mostly aligned stack with one dissenter: ETH 4H, 8 Oct 2026
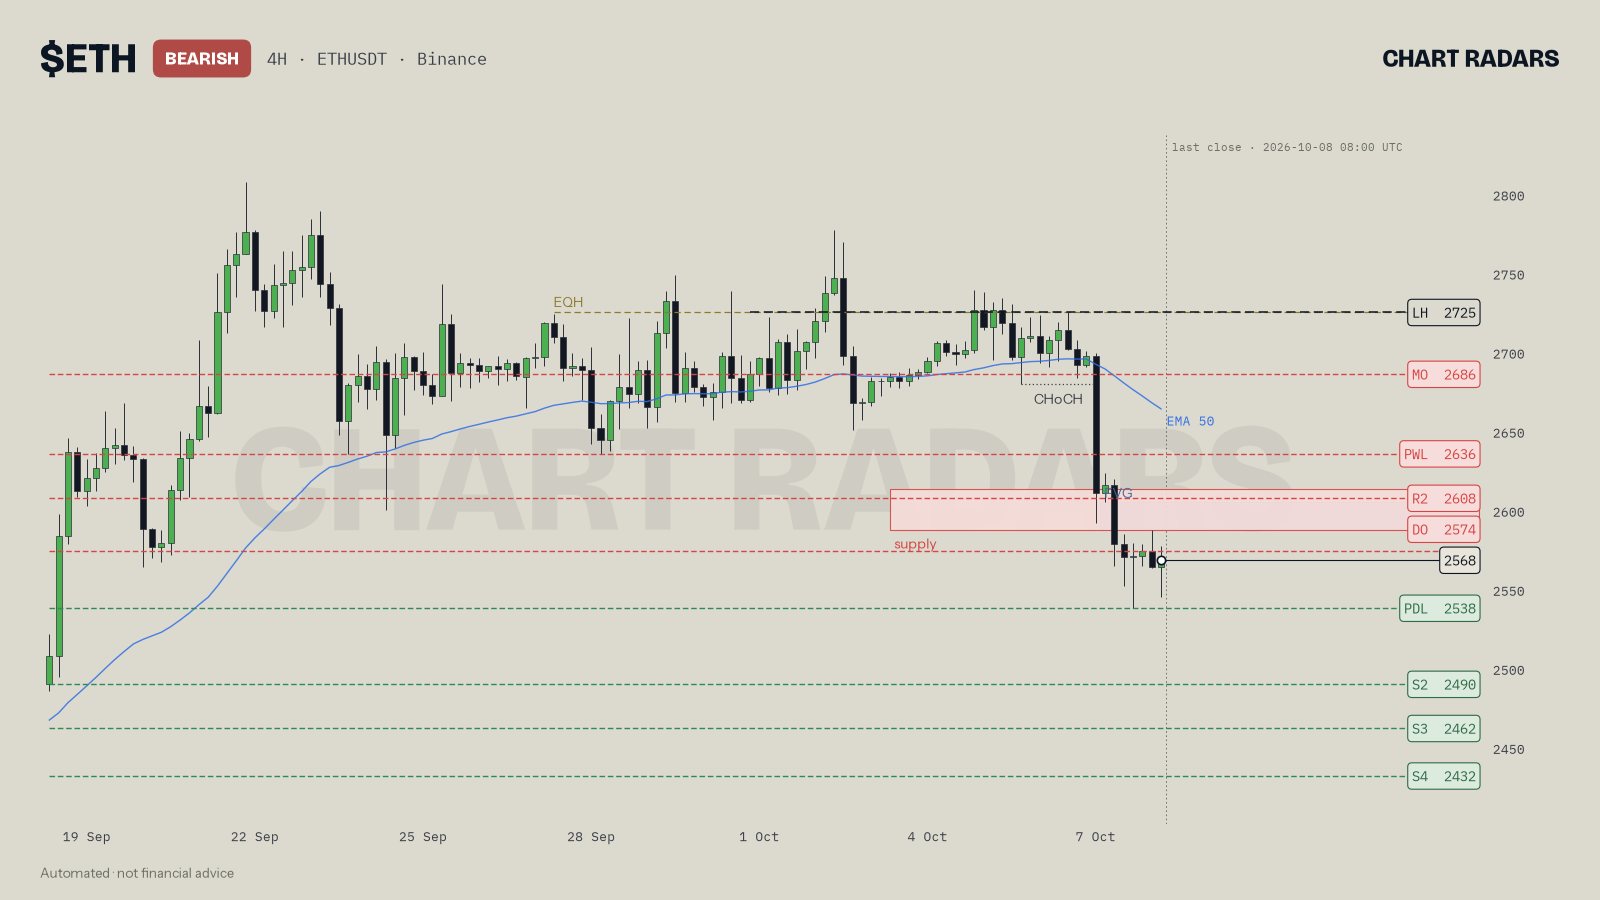
Here 4H and 1D are both bearish and 1W is bullish, and the read keeps a bearish bias. It does not hide the dissent: it says the weekly structure argues the other way, so it would be pickier with shorts and not hurry. It prefers a rally into the 2587 to 2614 supply area first, provided 2725, the last lower high, holds. A stack with two of three on one side is a lean, not a certainty, and the size and patience should show that.
In Chart Radars: A full read looks at several timeframes together: on a 1H chart it reads 1H, 4H, 1D and 1W, on a 4H chart it reads 4H, 1D and 1W, and on a 1D chart it reads 1D and 1W. The 15m chart is used only to check whether lower-timeframe structure has broken, for 1H and 4H reads. Each timeframe gets a bullish, bearish or range label from the structure rules. The bias is bullish or bearish only when more timeframes favour that side than oppose it and the chart you opened does not oppose it; otherwise the bias is neutral.
When does multi timeframe analysis mislead?
When you add timeframes until you find agreement. If the 4H disagrees, you open the 1H, and if that disagrees you open the 15m. By then you are not analysing, you are searching for permission.
When the higher timeframe is itself in transition. A weekly bullish label can survive a long pullback. It does not mean the daily cannot trend against it for weeks.
When the lower timeframe is mostly noise. A 15-minute structure shift in the middle of a range is not a confirmation. It is a swing.
When timeframes are too close together. A 1H and a 2H chart show nearly the same swings. The stack gives you less new information than it seems to.
Honest note: Alignment is not a green light. Three bullish timeframes can still produce a failed breakout, and a conflicting stack can resolve into a sharp move in either direction. Multi timeframe analysis improves the questions you ask, not the odds of any single trade. That is also why Chart Radars frames its reads as maps of conditions rather than forecasts.
Key takeaways
- Read top-down: weekly for backdrop, daily for trend, 4H for setup, 1H for timing. Three or four charts are enough.
- Write the stack in one line (for example "1W bullish, 1D bullish, 4H bearish"). That line is the analysis.
- Alignment gives a cleaner backdrop; conflict means the market is not committed, and range is the honest label.
- Use lower timeframes to confirm a plan, not to invent one, and decide the confirmation before price arrives.
- Alignment does not guarantee anything; always name the price that cancels the plan.
Frequently asked questions
What is multi timeframe analysis?
It is reading the same market on several chart timeframes, such as weekly, daily, 4-hour and 1-hour, so the larger picture frames the smaller one.
Which timeframes should I use for crypto?
A common stack is 1W for the backdrop, 1D for the trend, 4H for the setup and 1H for timing. Keep it to three or four, each about four to six times the one below.
What do I do when timeframes disagree?
Treat the conflict as information. A bullish higher timeframe with a bearish lower one usually means pullback or range, so wait for the edges or for the lower timeframe to realign.
Should I trade the higher or the lower timeframe trend?
The higher timeframe sets the direction you favour, and the lower timeframe is where you look for confirmation. Trading against the higher timeframe is possible but needs smaller size and tighter conditions.
Is top-down analysis better than bottom-up?
Top-down is safer for beginners because you know the backdrop before you look for detail. Starting from a 5-minute chart makes every small move look like a trend.