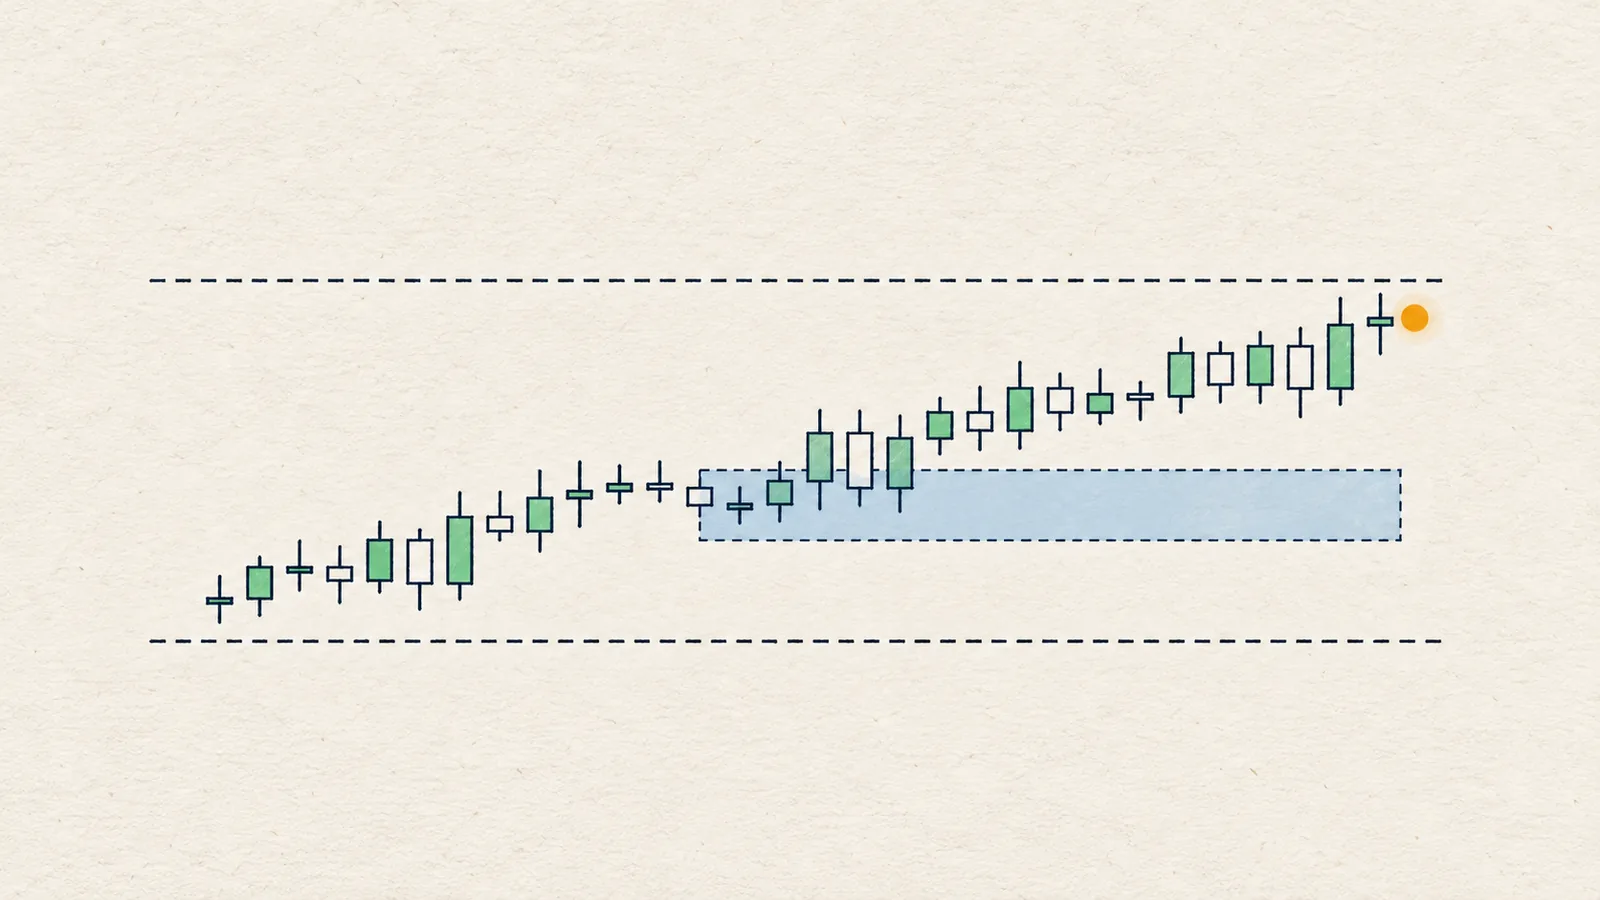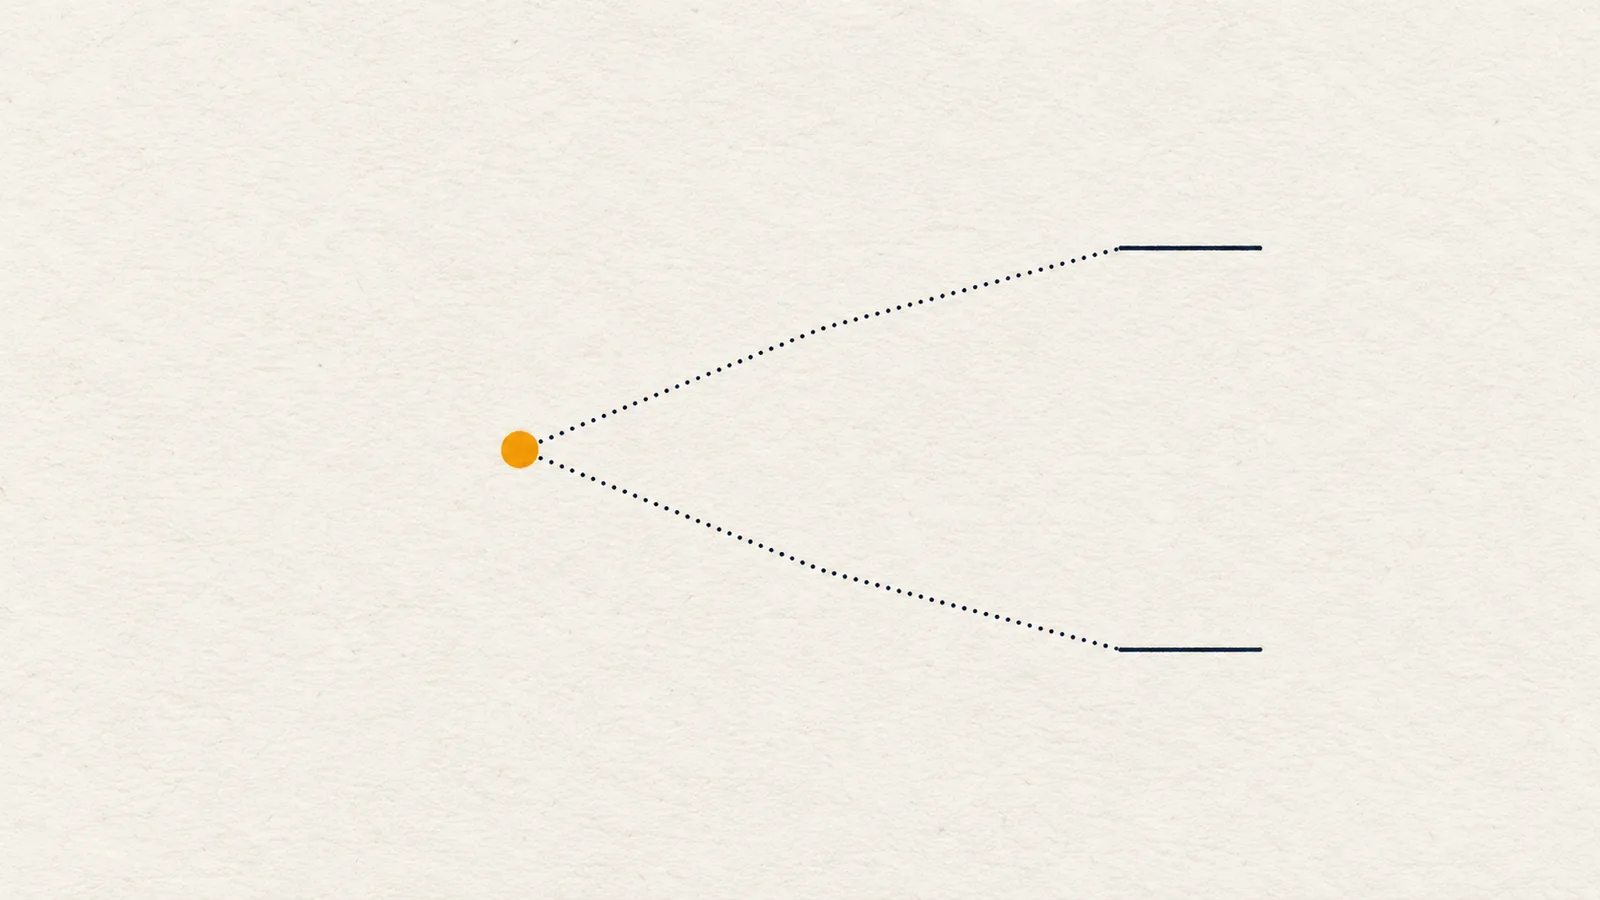
A trading scenario is a conditional plan for a chart: a trigger that must happen first, the reference prices that come next, and an invalidation level that cancels the idea. It is written as "if price does X, then Y; if it does Z, then W", and it replaces a prediction with something you can act on and check.
Why does a plan beat a prediction?
A prediction needs the market to cooperate. "Price will go up" is either right or wrong, and while you wait you have nothing to do except hope or panic. A plan is different. It says what you will do in each situation, so you are never surprised by either direction.
Three practical advantages:
- You decide before the pressure arrives. Choosing a stop in the middle of a fast candle is when most people choose badly. A written plan was made calm.
- You can be wrong cheaply. When the cancel level is defined, being wrong is a small, known event. Without it, being wrong is open-ended.
- You can say "nothing here". A forecast has to say something every time. A plan can say that none of its conditions has happened yet, which is the correct state most of the time.
None of this requires you to know where price goes. It requires you to know what you would do if it went either way.
What are the parts of a scenario?
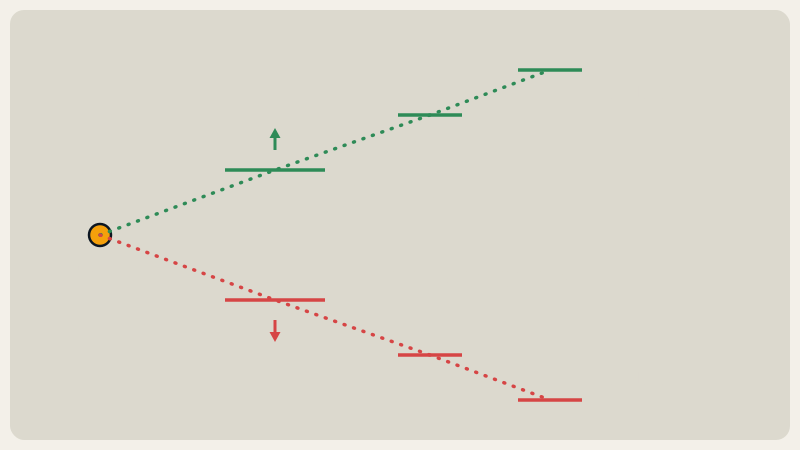
Every scenario has four parts:
- Context: the structure and bias the idea lives in ("4H bearish, 1D bearish").
- Trigger: the event that has to happen before anything else (a close above or below a level).
- Next reference prices: where price is likely to meet the next orders, usually the next few levels in the direction of the trigger.
- Invalidation: the price that proves the idea wrong.
The shape is always two-sided: one path for each direction. A one-sided plan assumes you know the direction; two sides force you to define what the other outcome looks like.
How do you choose a trigger?
The most reliable trigger is a candle close beyond a level on the timeframe you plan on. Touches and wicks happen constantly and often reverse in the same candle. A close shows that price spent a whole period beyond the level and was still there at the end.
Some rules of thumb:
- Same timeframe as the plan. A 4H plan needs a 4H close, not a 5-minute spike.
- Check participation. A close beyond a level on ordinary volume is weaker evidence than one on rising volume. This is context, not a verdict.
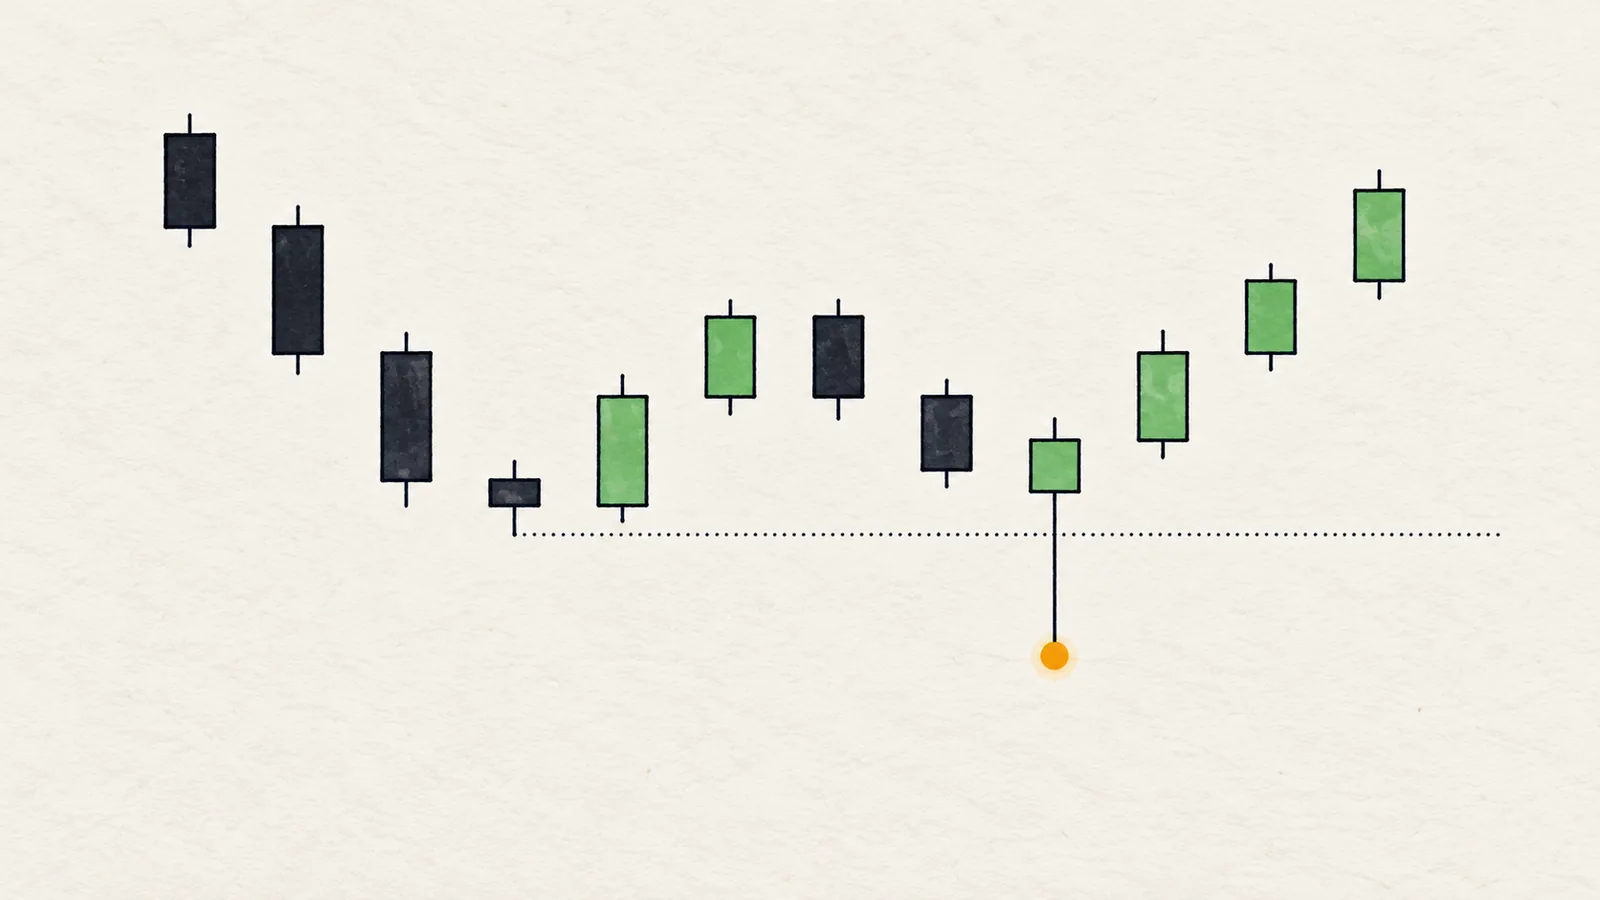
- Know the trap. Price that pokes beyond a level and returns is a liquidity sweep, not a trigger. Read liquidity sweep to tell the two apart, because the same candle can start a break or end a fake-out.
- Have an alternative trigger for pullbacks. If you prefer entering on a pullback into a zone, say what must be seen there (a lower-timeframe shift, an engulfing candle) rather than acting on the first touch.
How do you choose invalidation?
Invalidation is not "where my stop is". It is the price that, if reached on a close, means your reason is gone. That is a structural question.
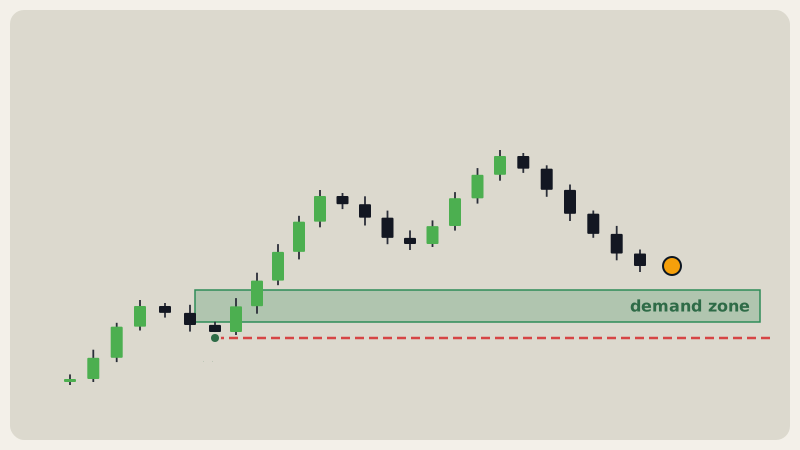
In an uptrend the invalidation is usually the last higher low; in a downtrend, the last lower high. These are the swing points that carry the trend. A close beyond them means the sequence of higher lows (or lower highs) has failed. Place it where being wrong is unambiguous and then size the position around that distance, not the other way round.
Three checks:
- Is it far enough? If the invalidation is almost on top of your entry, normal noise will trigger it. Measure the distance in units of the coin's typical candle size, not in dollars.
- Is it logical? It should be where the story fails, not where a round number is convenient.
- Does it coincide with other evidence? An invalidation that also sits at an obvious cluster, such as equal highs, is both a structural point and a place where stops gather, so expect a spike there and wait for the close.
Why is "no edge in the middle of a range" a valid read?
When price sits between two levels with no clear lean, the distance to each edge is similar, so neither side has a better ratio of reward to risk. Acting there means choosing a direction without a reason.
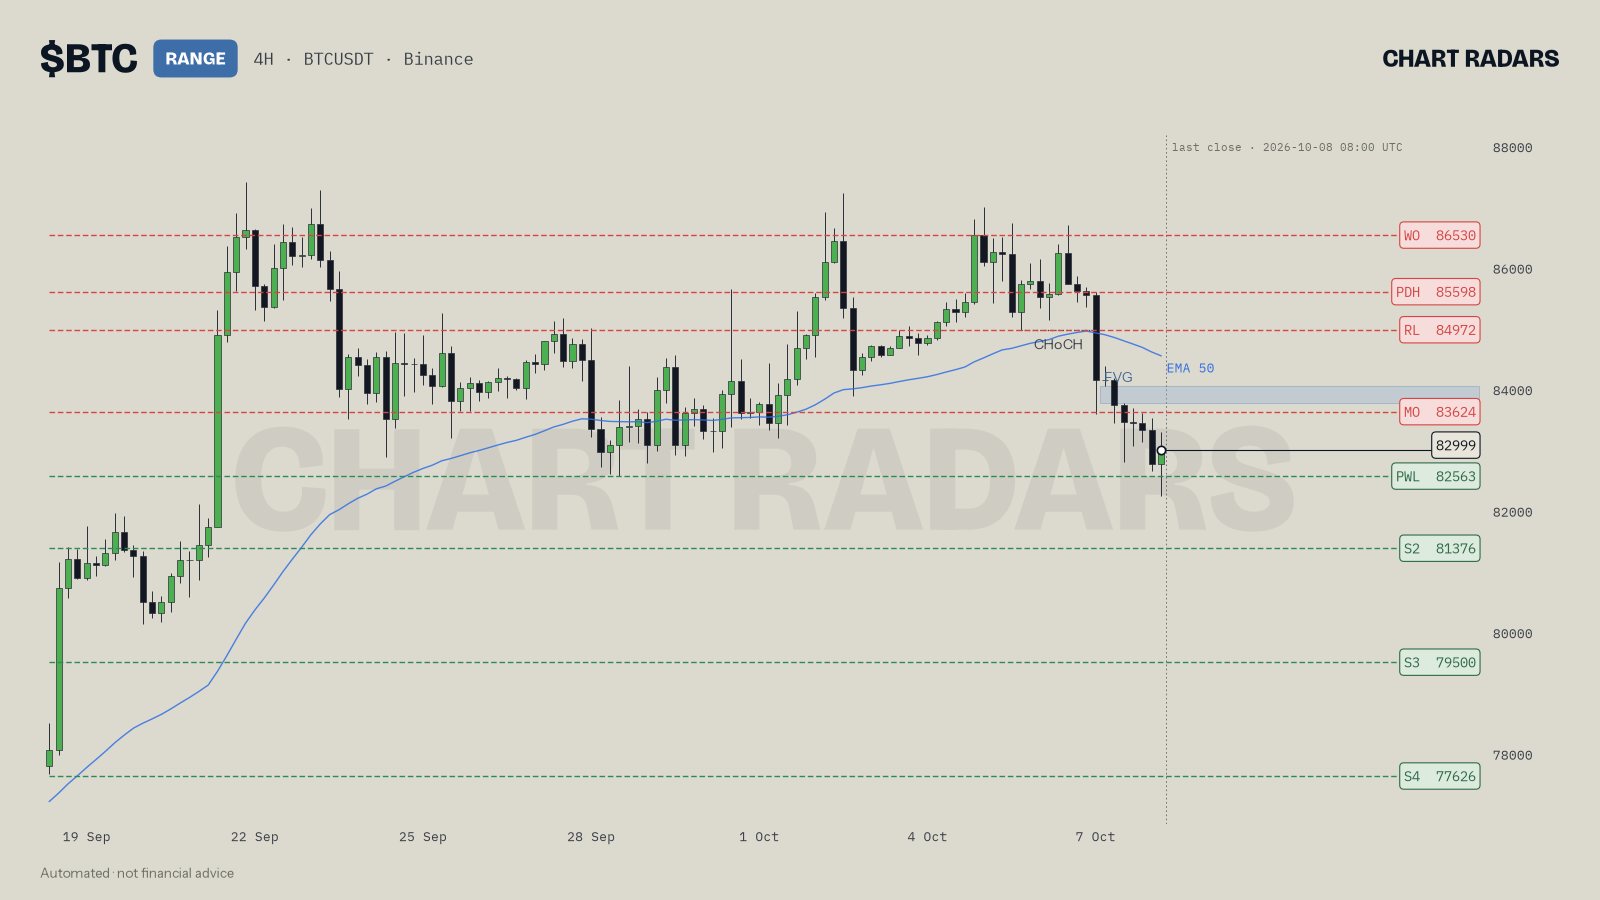
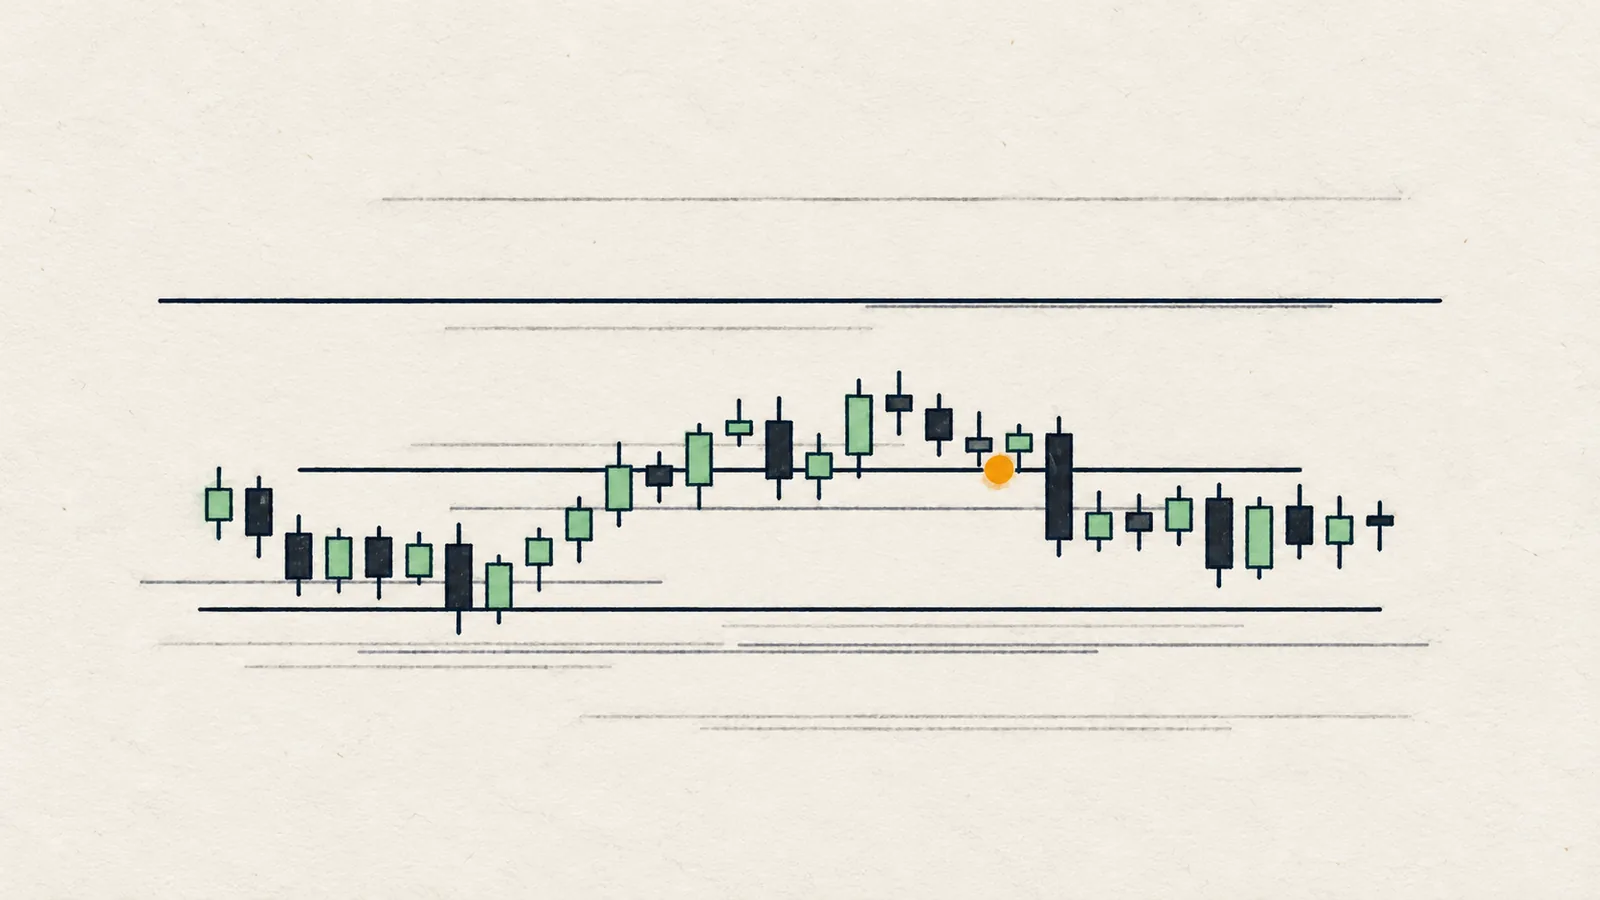
BTC on the 4H chart, close of 8 Oct 2026 (08:00 UTC), shows how this reads in practice. Price is about 82999. The 4H read is bearish while the 1D and 1W are bullish, so the bias is neutral, and the chart is labelled RANGE. The read marks the range as 82563 (prior-week low) to 83624 (monthly open) and states there is no edge in the middle, so it only acts at the edges.
Written as scenarios:
- Long: only after a sweep and reclaim of 82563.
- Short: only after a rejection at 83624, which has been tested twice.
- Break up: a 4H close above 83624 ends the range; the next references are 84972, 85598 and 86530.
- Break down: a 4H close below 82563 ends the range; the next references are 81376, 79500 and 77626.
The read adds that volume is not confirming yet (1.2 times its recent average) and that open interest is down 1.5% in 24 hours. Every line is a condition. None is a forecast. If none triggers, the plan is to do nothing, and that is a decision, not a failure.
Worked example: a bearish plan with a cancel level
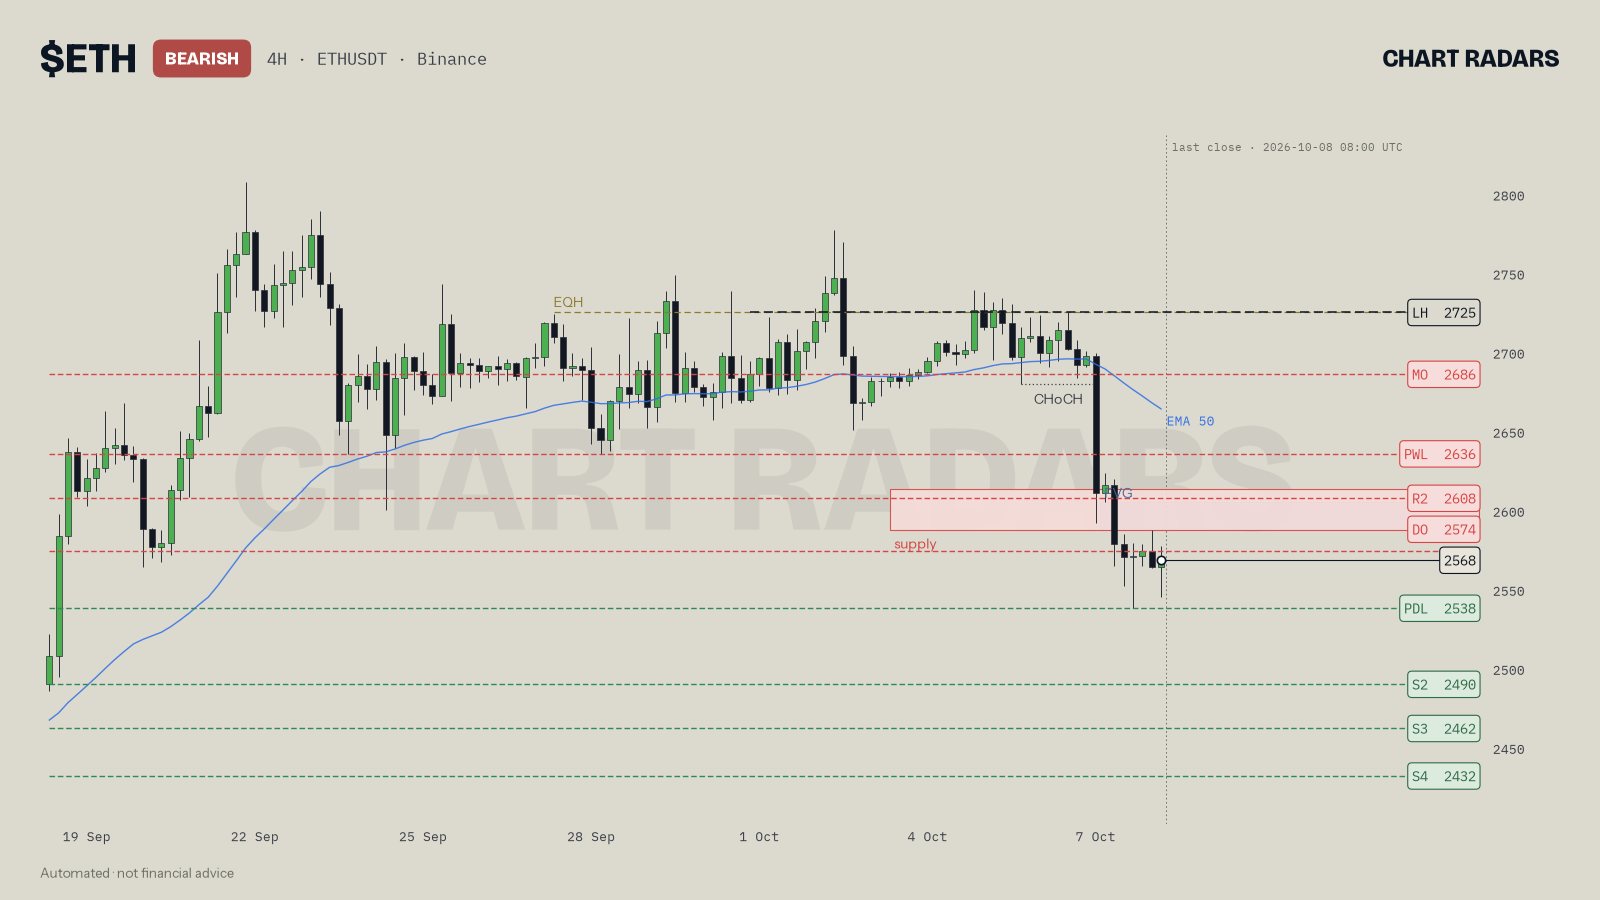
ETH on 4H, close of 8 Oct 2026 (08:00 UTC), price about 2568. The chart is labelled BEARISH, with 4H and 1D bearish and the 1W still bullish. The last structure break is a CHoCH downward, and the last lower high is at 2725, which also lines up with equal highs.
The read turns this into a plan:
- Context: 4H and 1D bearish. The read itself notes that the 1W structure is bullish and against the bias, so it asks for more selectivity with shorts.
- Preferred path: a rally first into 2587 to 2614, where a supply zone overlaps a bearish FVG, and only then a continuation lower, provided 2725 holds. With no 15-minute shift down yet, the read keeps its hands off until one prints.
- If the bounce fails: a 4H close below the 2538 prior-day low (which has been tested 9 times) opens the way to 2490, then 2462, then 2432.
- Invalidation: a 4H close above 2725 means the bearish structure has failed and the read is void.
- Context from derivatives: open interest is $6.2B, down 2.4% in 24 hours, so positions are being closed more than opened. Funding is slightly negative at -0.0020%.
Look at how the pieces fit. The trigger is a close, not a touch. The targets are chosen reference prices, not wishes. The invalidation is a swing, and it sits at a place where stops would gather, so the read waits for a close above it and not a wick. And if the rally into the zone never happens, there is no trade.
How do you write your own scenario?
- Read the bigger timeframes first and write down the bias in one word.
- Mark the nearest level above and the nearest level below price.
- Write the up condition: "If a [your timeframe] close above A, then B and C."
- Write the down condition: "If a close below D, then E and F."
- Write the cancel: "If a close beyond [protecting swing], the idea is void."
- Add one line for the middle: "Between D and A, I do nothing."
- Check that the invalidation distance fits your risk. If it does not, skip the setup.
The method behind steps 1 and 2 is in how to read a crypto chart.
What goes wrong with scenarios?
- Moving the invalidation after entry. If you shift the cancel level to avoid being stopped, the plan was never a plan.
- Writing only the scenario you like. One-sided plans hide the other half of the market.
- Too many targets. Four steps are plenty; each should be meaningfully apart from the last.
- Treating a scenario as certainty. It is a map of conditions. It will sometimes be cancelled.
More on the traps around this in chart reading mistakes.
In Chart Radars: a full read lays out two conditional paths: "a close above X opens Y and Z" and "a close below W opens...". The target ladder has at most 4 steps, at least 0.5 ATR apart (ATR is the average candle size over 14 candles). Invalidation is the nearest swing that carries the direction, a higher low in a rise or a lower high in a fall, between 1 and 6 ATR from entry; a close beyond it voids the read. The pullback zone is an open FVG and/or the nearest level (plus or minus 0.2 ATR), within 5 ATR of price and never beyond the protecting swing. When price sits in the middle of a range, the read says to wait for the edges. With the optional radar on, it follows its scenarios for 72 hours and replies in the same message.
Honest note: a scenario does not make the outcome likelier; it makes your response clearer. Chart Radars' own back-testing found that the trend label alone showed no strong directional edge, which is exactly why the output is a map of conditions with if/then paths rather than a call. Sometimes a plan is cancelled on the next candle. That is the plan doing its job.
Key takeaways
- A scenario is a trigger, next reference prices and an invalidation, written for both directions.
- Prefer a candle close on your timeframe as the trigger; a wick can be a sweep.
- Put invalidation at the swing that carries the structure, and size the position around it.
- "No edge in the middle, wait for the edges" is a complete and valid plan.
- A plan is judged by whether you followed it, not by whether price agreed.
Frequently asked questions
What is invalidation in trading?
Invalidation is the price at which your trade idea is proven wrong, not just the price where a stop happens to sit. If a candle closes beyond it, the reason you entered no longer holds and you step aside instead of hoping.
How do I make a trading plan with if/then scenarios?
Write one condition for each direction, each with a trigger (usually a candle close beyond a level), the next reference prices as targets, and one price that cancels the idea. If the condition does not happen, you do nothing.
Where should I place invalidation?
Beyond the swing that carries the structure: the last higher low in an uptrend, the last lower high in a downtrend. Put it where being wrong is clear, then size the position so that distance fits your risk.
Is it OK to not trade when price is in the middle of a range?
Yes. In the middle of a range the distance to both edges is similar, so neither direction has a clear advantage. Waiting for price to reach an edge, or to close beyond it, is a valid and often better decision.
Why is a trigger usually a close and not a touch?
A wick can pass a level and return within the same candle, which is how sweeps work. A candle close beyond the level shows price accepted the move for at least one full period, which filters out many false breaks.