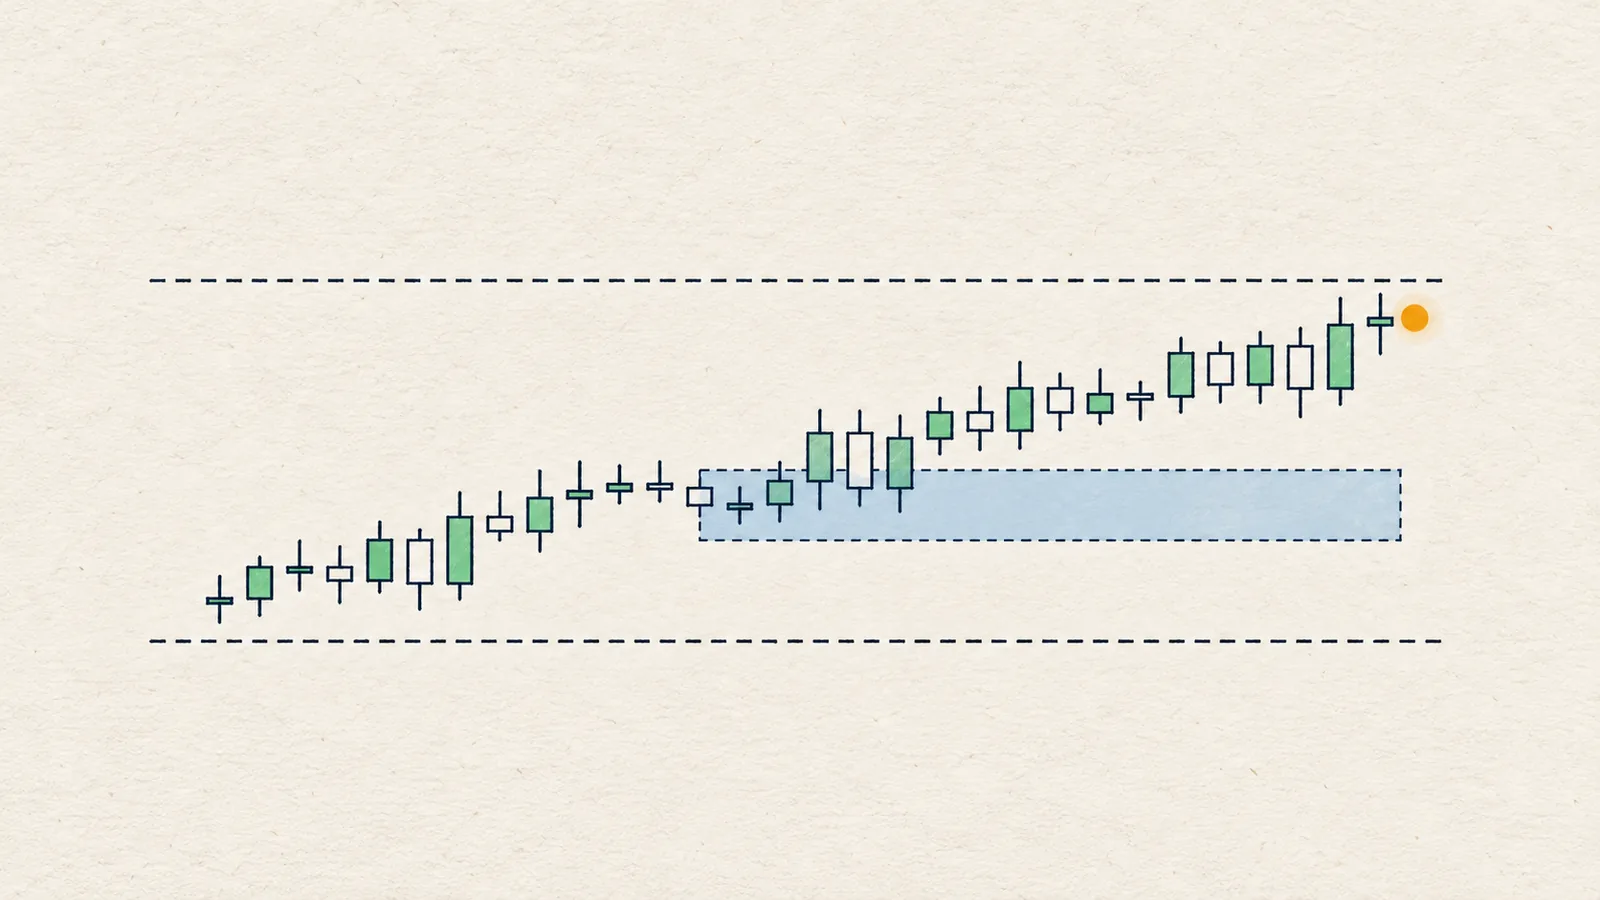
Chart reading mistakes are repeatable habits that make a read unreliable: looking only at a small timeframe, treating a wick as a break, drawing too many levels, trading the middle of a range, or skipping the price that proves an idea wrong. Most are process errors rather than knowledge gaps, which is good news: a process can be fixed.
Below are ten of the most common, in roughly the order they appear when you read a chart. Each has what it looks like, why it hurts and a concrete fix.
1. Why is reading only a small timeframe a mistake?
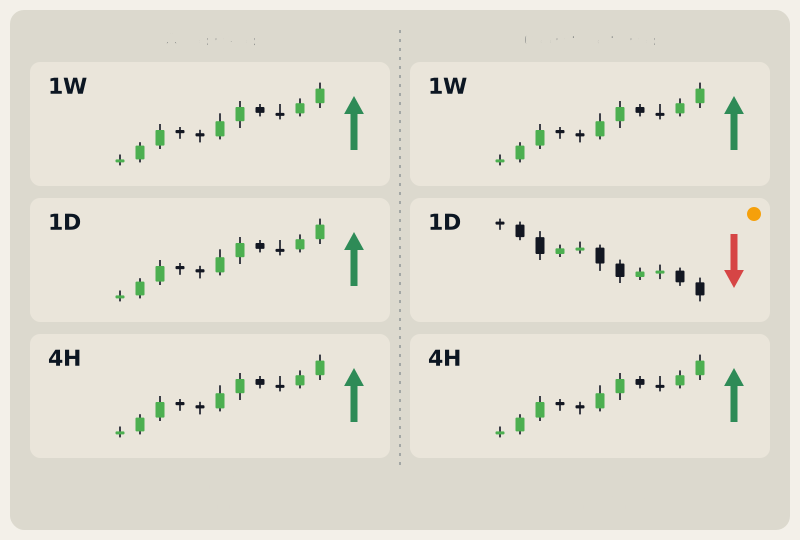
You open the 15-minute chart, see a clean higher-low structure and a tidy zone, and go long. On the daily chart the same candles are a small bounce inside a downtrend. The setup was real on its own scale and irrelevant on the one that matters.
Why it hurts: a lower timeframe sits inside a higher one. Counter-trend setups on a small chart get overwhelmed by the larger flow more often than they succeed.
The fix: read one or two timeframes above the one you act on before looking at anything else, and write one word per timeframe (up, down, range). If they disagree, you are looking at either a pullback or a turn, and the plan has to say which price would tell you. See how to read a crypto chart for the order.
2. Why is calling a break from a wick a mistake?
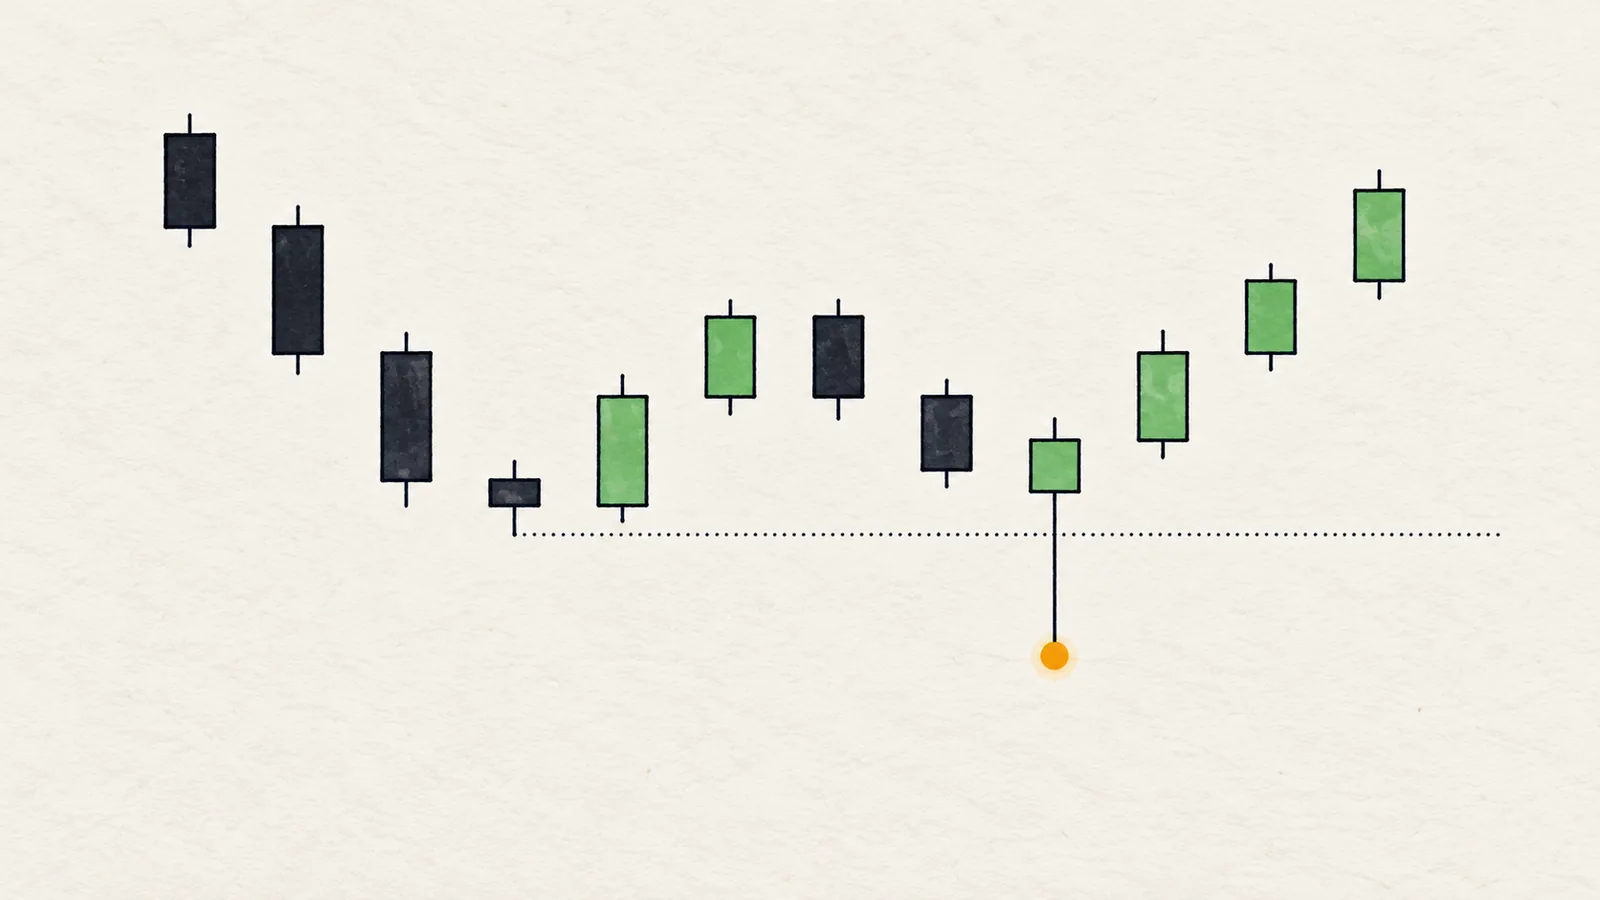
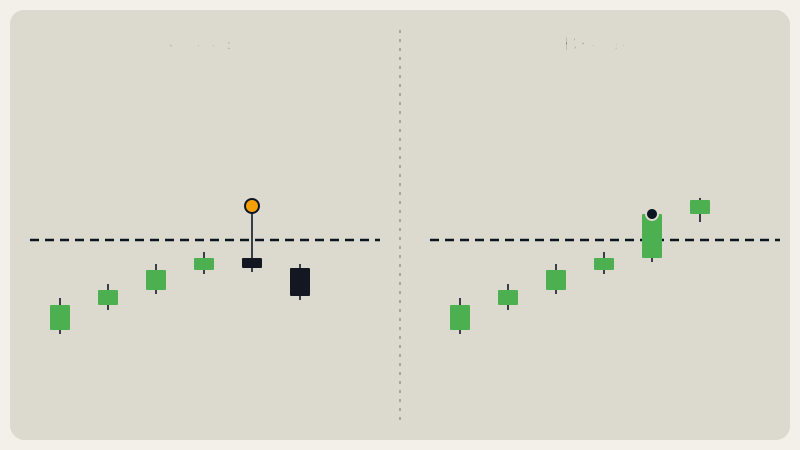
A candle spikes through a swing high, you mark a breakout and buy, and the candle closes back below the level. What you saw was a wick.
Why it hurts: the area just beyond an obvious high or low is where many stop orders sit. A wick that collects them and returns is a liquidity sweep, not an acceptance of higher prices.
The fix: require a close beyond the level on your timeframe. A body that closes beyond the level is a break; a wick that returns is a sweep. Apply the same rule to structure: a break of structure or a change of character counts only when a candle closes beyond the swing point. The full distinction is in BOS vs CHoCH.
3. Why is treating every sweep as a reversal a mistake?
Sweeps are popular, and many traders learn the pattern as "wick, then reversal". So they treat every wick past a swing as a free entry.
Why it hurts: a sweep tells you stops were taken, not what happens next. Sometimes it is the first step of a real break; sometimes it is the end of a move. Context decides which.
The fix: use a sweep as a place to define risk, not a prediction. Ask: does the sweep agree with the higher-timeframe structure? Is there a clear swing beyond it that would prove you wrong? Read liquidity sweep before trading one.
Here is a case where a sweep is on the chart and the read still does not lean.
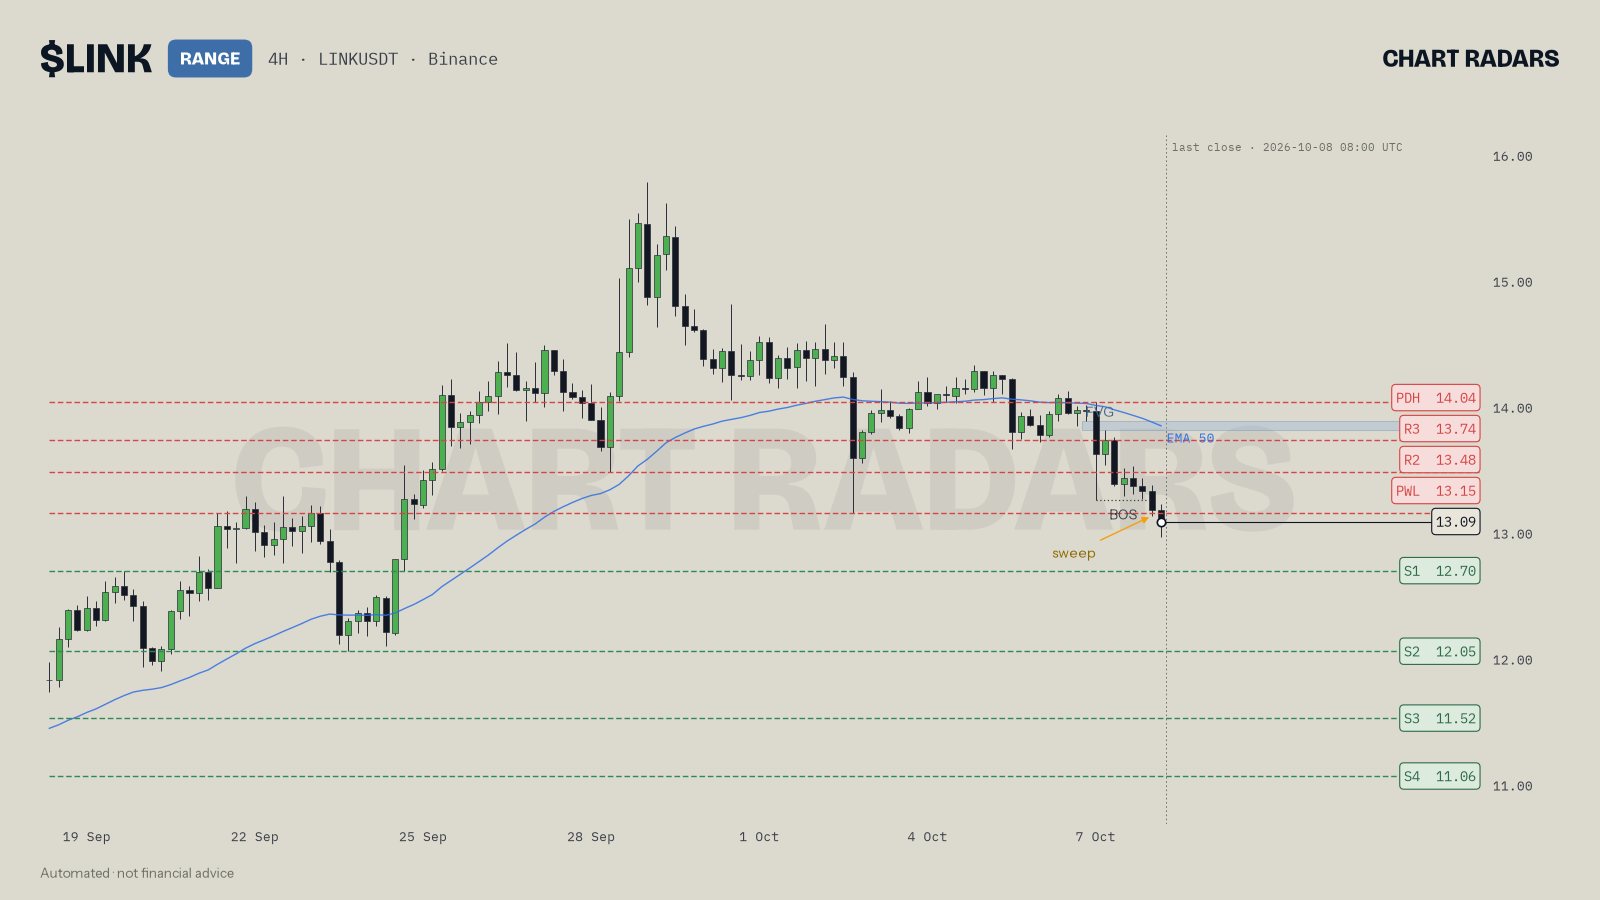
LINK on 4H, close of 8 Oct 2026 (08:00 UTC), price about 13.09. The chart marks a sweep of the low at 13.152 (the prior-week low) and a BOS downward. A beginner might see "sweep" and read "bounce". The read does not: 4H is bearish while 1D and 1W are bullish, the chart is labelled RANGE, the bias is neutral, and LINK has underperformed BTC by 3.4% over 24 hours. The read says there is no edge in the middle of the 12.70 to 13.15 range and waits for the edges. A sweep was present; a case was not.
4. What goes wrong when you draw too many levels?
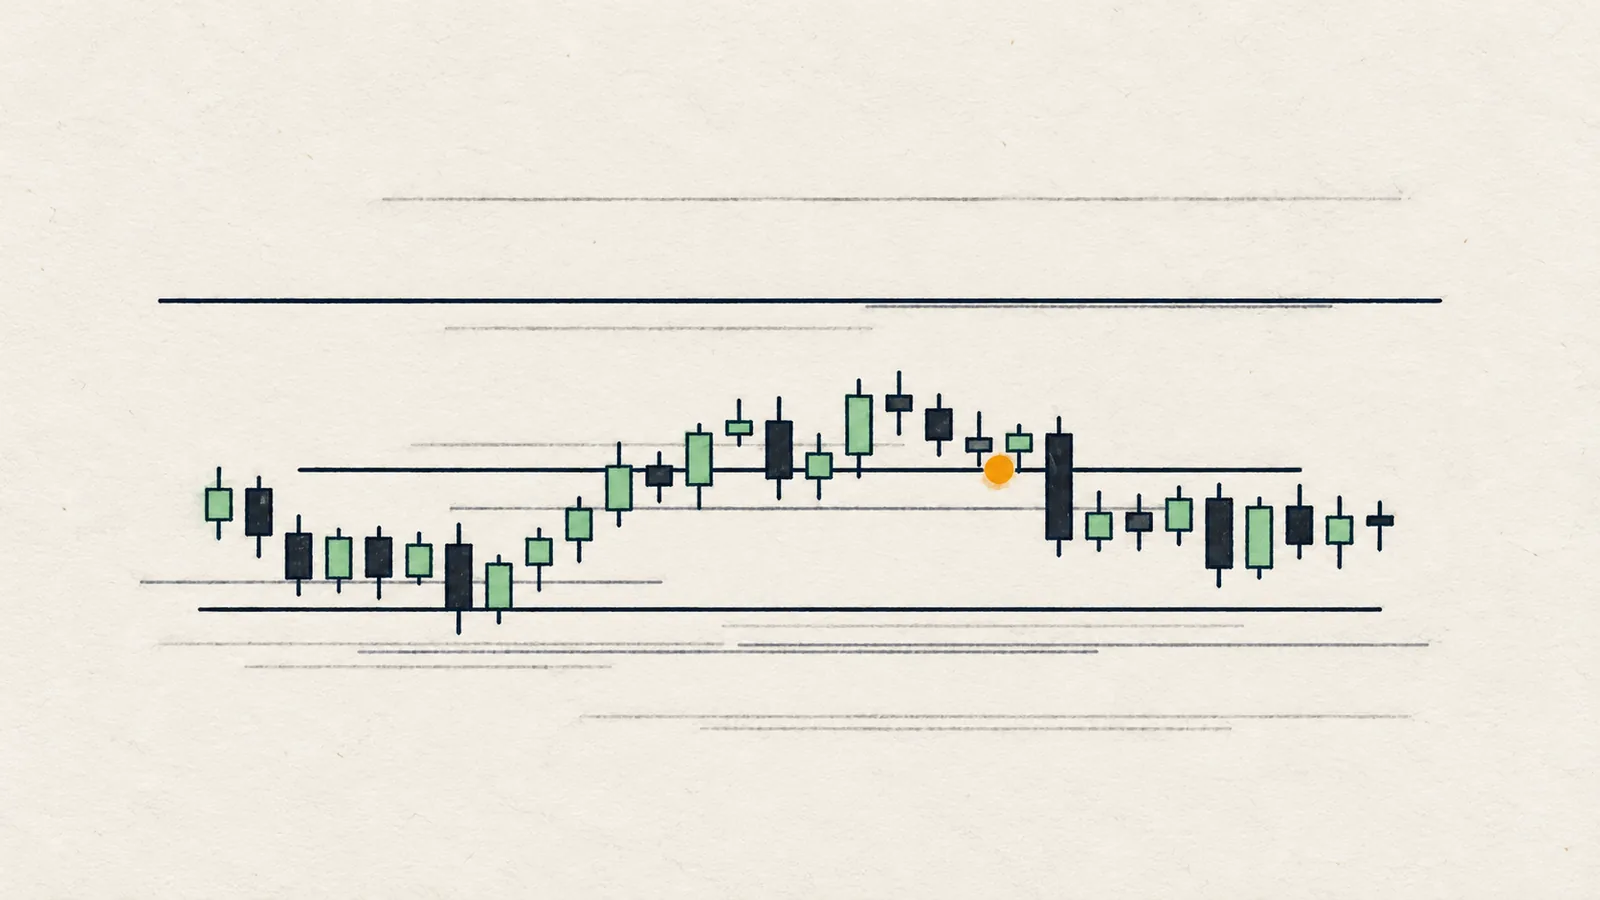
Every swing gets a horizontal line, every number ending in 00 gets another, and soon the chart is striped. Whatever price does, it is "reacting to something".
Why it hurts: with enough lines, any candle can be explained afterwards. You also stop being able to tell the important level from the incidental one.
The fix: mark the three or four closest levels above price and below it. Treat each as a zone, not a laser line, because price often reacts a little before or after the exact figure. Let nearby swing points merge into one level, and give priority to levels with a reason, such as repeated tests or a clear reference price like the weekly open or the previous week's low.
5. Why is trading the middle of a range a mistake?
Price is between a clear low and a clear high, drifting. You see a candle you like and take it.
Why it hurts: in the middle, the distance to both edges is similar, so reward and risk are about equal and nothing in the chart favours either side. Most of the noise lives here.
The fix: accept "no edge here" as a valid read. Define the edges, say what you would do after a sweep and reclaim of one edge or a close beyond it, and wait. The LINK example above is that read: it says the middle of a range is no man's land and waits for the edges. Sitting out costs nothing; a poor entry does.
6. Why is chasing a move a mistake?
A large candle prints, price is far from any level, and fear of missing out says to get in now. The entry has a distant invalidation and little room to the next reference price.
Why it hurts: the further price is from the level that proves you wrong, the larger the risk for the same position size, and the closer you usually are to the next level that can stall it. Reward shrinks while risk grows.
The fix: decide the zone beforehand and let price come to it. If it never does, there was no trade. This is also why a pullback plan names the area and what must be seen there (for example a shift on a lower timeframe), rather than reacting to the first touch.
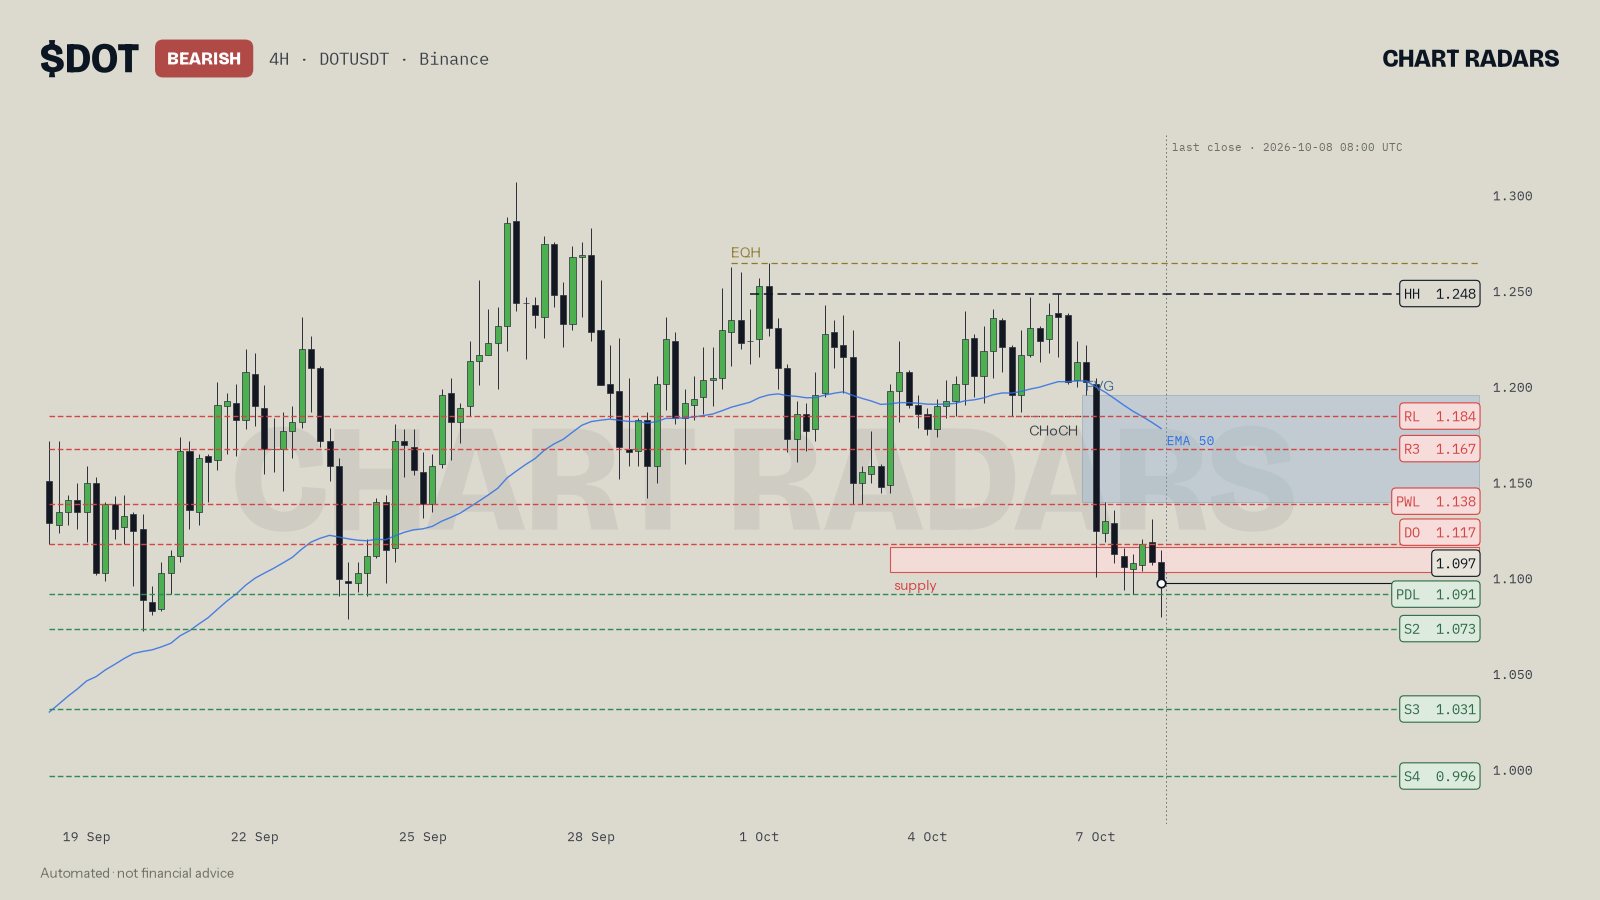
DOT on 4H, close of 8 Oct 2026 (08:00 UTC), price about 1.097. The read has a bearish bias, with 4H, 1D and 1W all bearish, and the ideal entry is not a chase: it is a bounce into 1.103 to 1.115, where supply sits. Since the 15-minute chart has not shifted down yet, the read says to wait for that shift instead of selling blind, and it ends with "I would not chase this move". The cancel level is clear: a 4H close above 1.248.
7. What goes wrong when you use an indicator as a trigger?
RSI shows a divergence, funding is high, the long/short ratio is stretched, and you act on one of them as if it were an entry.
Why it hurts: these describe conditions, not timing. Divergence can persist for many candles. Crowded positioning can last while price continues. A trigger needs structure, a level and a close.
The fix: place indicators in the "context" column. In the DOT read, a bearish RSI divergence on 4H and long positioning that looks crowded are both described, and both are used only to strengthen a plan that already exists: they leave room for a flush toward 1.103 and agree with the bearish bias. Neither is a reason to enter by itself.
8. Why is ignoring conflicting timeframes a mistake?
The 4H is bearish and the weekly is bullish, but you only mention the one that supports your idea.
Why it hurts: selective reading is how confirmation bias works. The conflict is information. It tells you the move may be a pullback, or that the larger trend may be turning, and that you should be pickier with what you take.
The fix: write down every timeframe, including the ones you dislike. When they disagree, the read should either go neutral or state the conflict and lower the conviction. The ETH read does exactly this: 4H and 1D are bearish, 1W is still bullish, and the read notes that it is "against my bias" and asks to be pickier with shorts.
9. Why is having no invalidation level a mistake?
You enter because the chart "looks bearish", with no price that would change your mind. When price goes the other way, you move the stop, then remove it, then hope.
Why it hurts: without a defined cancel level, risk is open-ended and the decision to exit is made under stress.
The fix: before entry, name the swing that carries the structure (the last higher low in a rise, the last lower high in a fall) and state that a close beyond it voids the idea. Size the position around that distance. Then do not move it. The method is in trading scenarios and invalidation.
10. What goes wrong when you read the chart in hindsight?
Looking at a chart after the move, everything is obvious: the swing, the sweep, the zone. You draw levels that you only know matter because of what price did next, then conclude that you "would have" seen it.
Why it hurts: it builds false confidence. Swing points are only confirmed after a few candles have passed, and the live chart always looks messier than the replay.
The fix: practice on the live edge. Write your read and your scenarios before the next candles close, and compare afterwards without editing. Keep a log of what the plan said versus what you did. The goal is process, not hit rate.
In Chart Radars: several of these slips are removed by definition. A structure break counts only on a close beyond the last confirmed swing point (a swing needs 3 lower or higher candles on each side). A sweep is a wick past a swing from the last 40 candles, in the last 3 candles, that closes back inside; a body that closes beyond is a break. The trend read needs structure, a close at least 0.3 ATR from the 50 EMA and an EMA slope in the same direction over 10 candles, otherwise it says range (the chart header shows the overall bias, with RANGE meaning neutral). Levels merge when swings are within 0.6 ATR and only the ones within 12 ATR of price are shown. The bias is neutral unless more timeframes support it than oppose it and the main chart is not against it. RSI divergence is checked over the last 15 candles. "Crowded longs" needs a long/short ratio of at least 1.5 plus either taker buying at least 1.2 times selling or funding of at least 0.01%. Every distance is in ATR, the average candle size over 14 candles.
Honest note: knowing these ten mistakes will not make you right more often by itself. Chart Radars' own back-testing found that the trend label alone showed no strong directional edge, which is why its output is a map of conditions and not a call. Avoiding the mistakes does something more modest and more useful: it keeps your decisions consistent, your risk defined and your reading honest, so that a bad outcome does not also mean a bad process.
How do you use this list?
Pick the two mistakes you recognise most and watch for them on your next five reads. A short pre-trade checklist helps:
- What do the higher timeframes say, in one word each?
- Did a candle close beyond the level, or was it a wick?
- Am I in the middle of a range?
- What is the invalidation, and does the distance fit my risk?
- Is this entry a plan or a chase?
Key takeaways
- Most reading errors are process errors: skipped timeframes, wicks taken for breaks, no cancel level.
- Require a close for breaks; treat a wick that returns as a sweep and read its context.
- Draw few levels, treat them as zones, and accept "no edge in the middle".
- Indicators and positioning data are context for a plan, never the trigger.
- Name your invalidation before entry and write your read before the next candles close.
Frequently asked questions
What are the most common mistakes when reading crypto charts?
Reading only a low timeframe, treating a wick as a break, calling every sweep a reversal, drawing too many levels, trading the middle of a range, chasing moves, using an indicator as a trigger, ignoring conflicting timeframes and having no invalidation.
Why do my technical analysis calls keep failing?
Often the issue is not the tool but the process: no higher timeframe context, no defined invalidation, entries without confirmation, or reading the chart after the move. A fixed reading order and a written if/then plan remove most of these.
Is a wick through a level a breakout?
Not by itself. A wick that passes a level and closes back inside is a liquidity sweep. A breakout needs a candle body to close beyond the level. Waiting for the close filters out many false breaks.
How many support and resistance levels should I draw?
Only the three or four closest above and below price. Treat each as a zone, not an exact line, and let nearby swing points merge into one. A chart with twenty lines can support any story.
Should I trade on RSI divergence or funding on its own?
No. RSI divergence, funding and long/short ratios describe conditions, not triggers. They can make a read more or less cautious, but entries should still come from structure, a level and a confirmation on your timeframe.