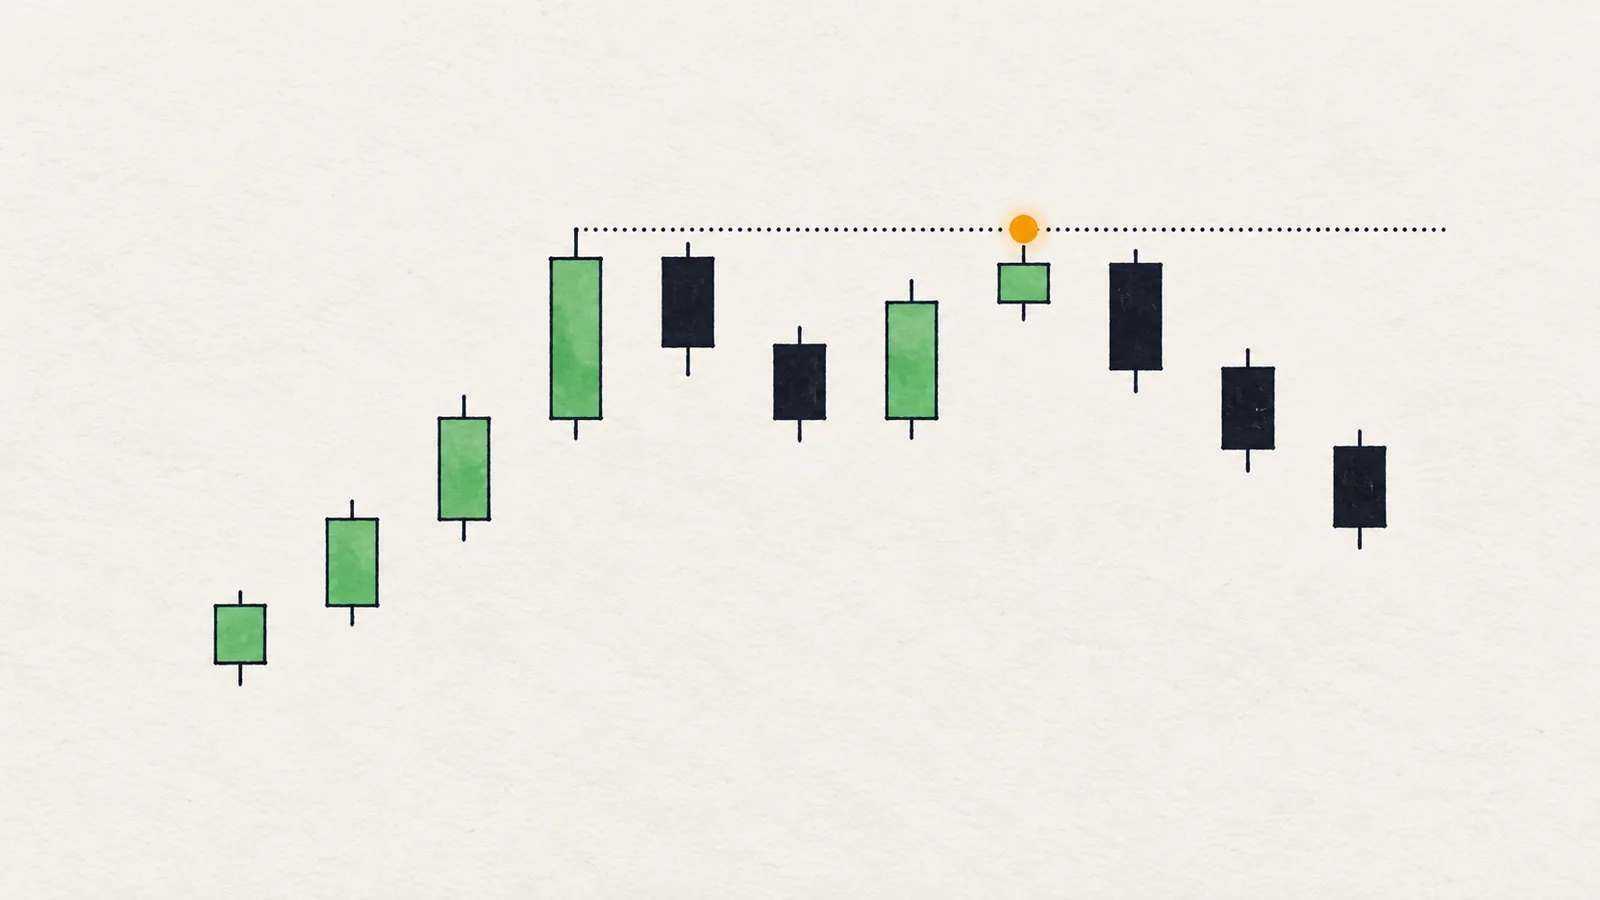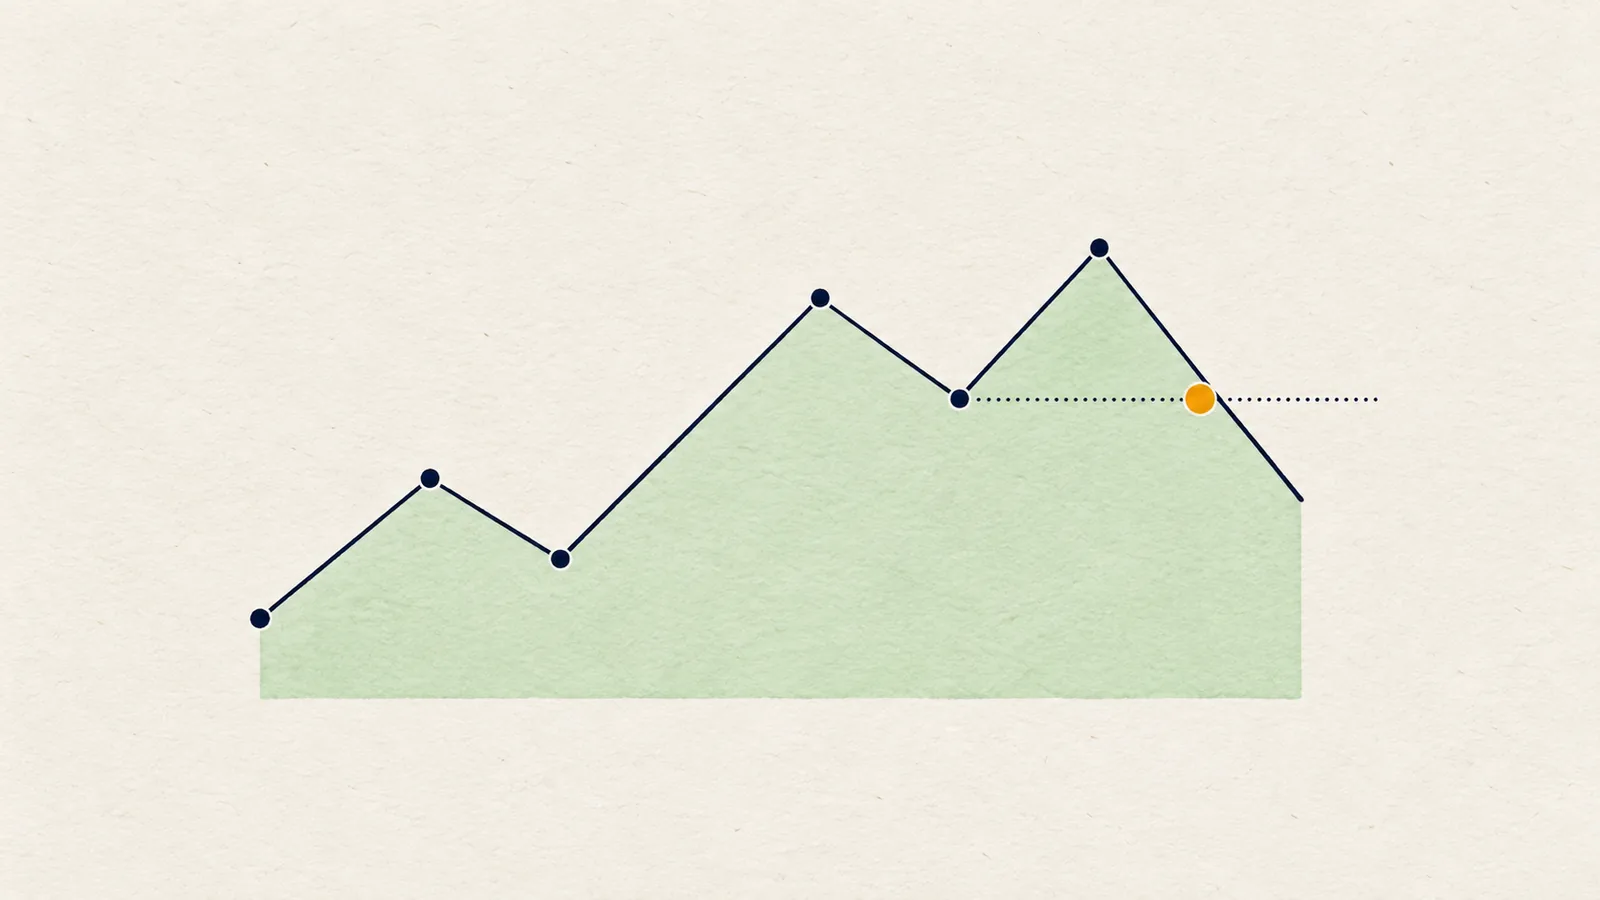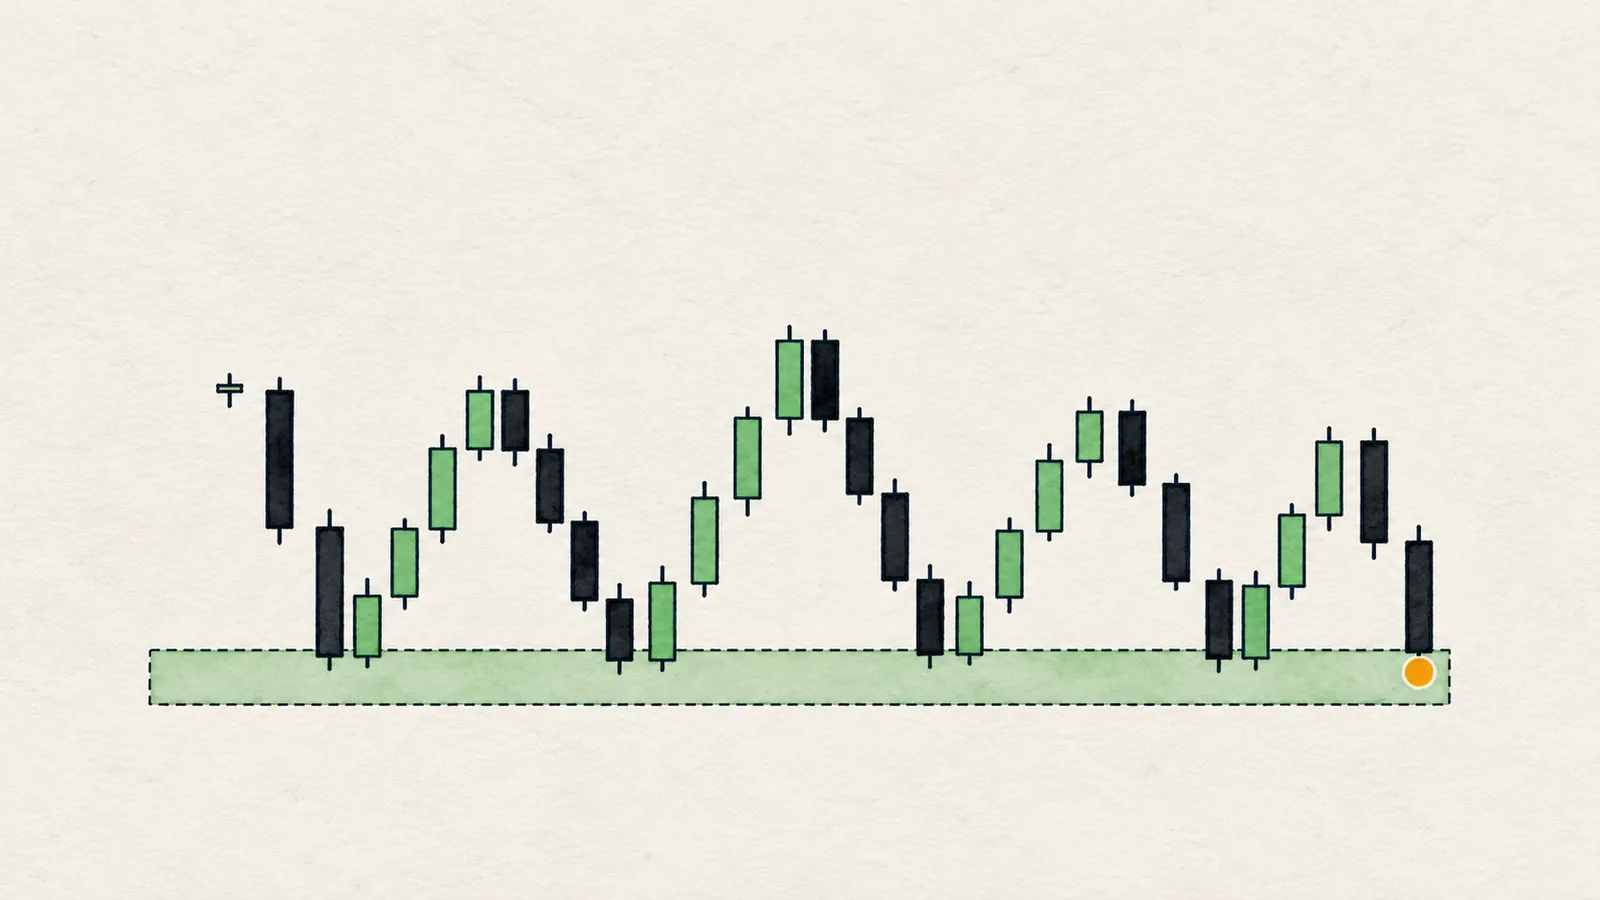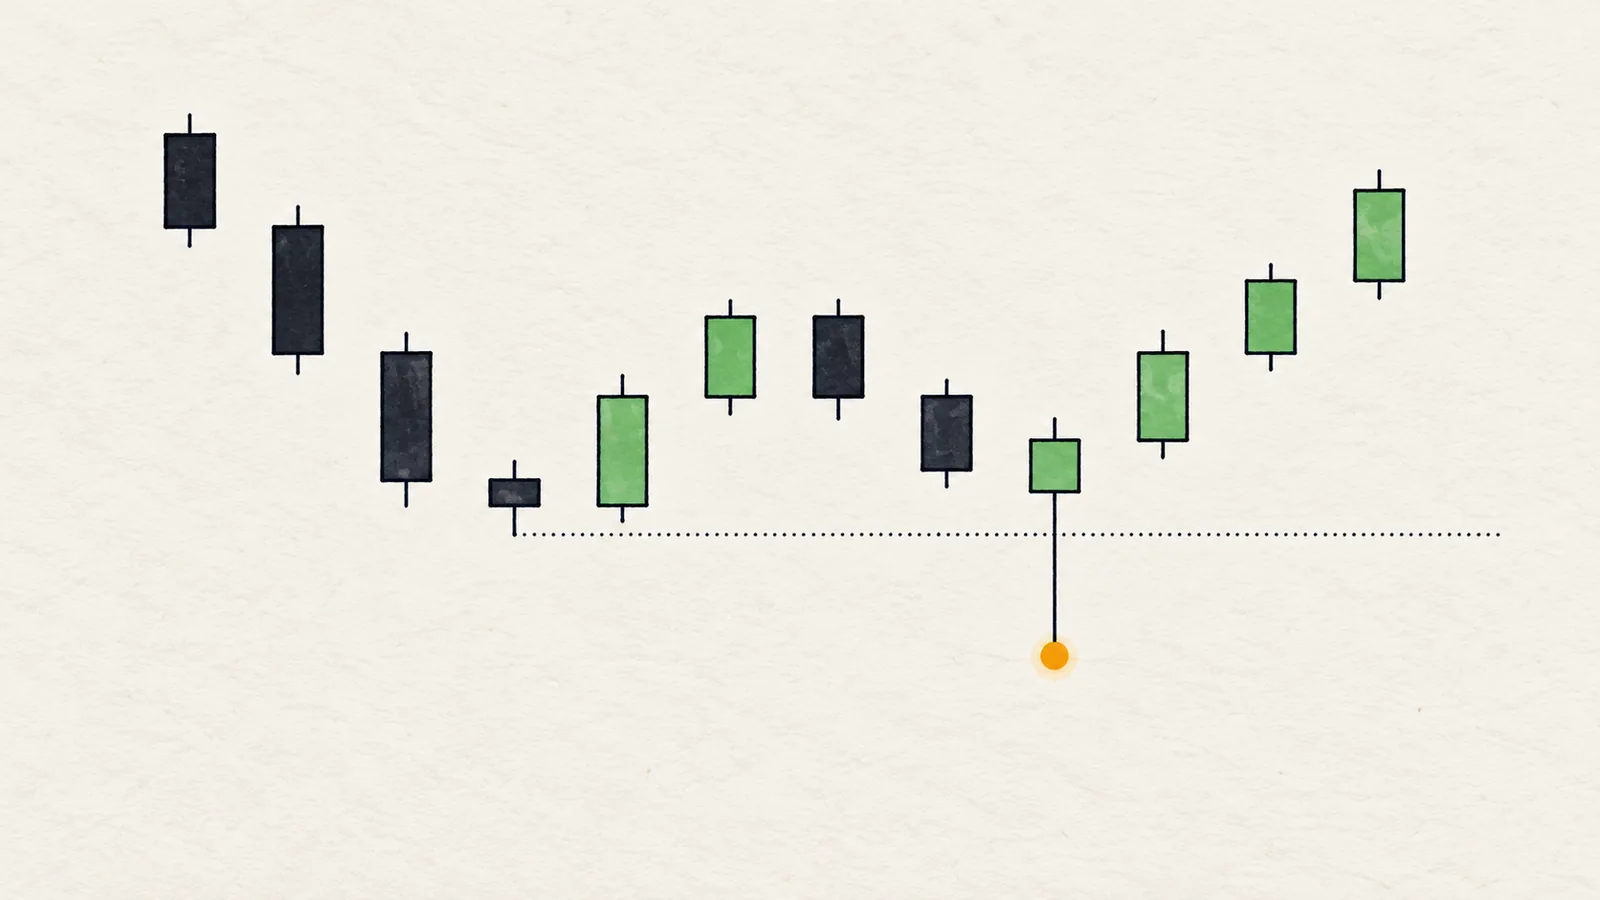
A liquidity sweep is a price move in which a candle's wick extends beyond a recent swing high or swing low, triggering the stop orders and breakout entries resting there, and the candle then closes back on the original side of that level. The wick passes the level; the close does not.
That one-sentence definition hides the useful part. A sweep tells you where other traders were wrong-footed, and where the market may be about to pick a direction. This guide explains what liquidity is, why price visits it, how to tell a sweep from a real breakout, and how to turn it into an if/then plan instead of a guess.
What is liquidity in crypto trading?
Liquidity here means orders waiting to be filled. For price to move, someone has to be on the other side of every trade. Big orders need a lot of counterparties, and the places where counterparties are most likely to be found are the places where many traders placed orders in the same spot.
Those spots are predictable because traders follow the same habits:
- A long position usually has its stop-loss just under the most recent swing low.
- A short position usually has its stop-loss just above the most recent swing high.
- Breakout traders place buy orders above a high and sell orders below a low, to enter when the level breaks.
A stop-loss on a short is a buy order. A stop-loss on a long is a sell order. So the area above an obvious high holds a pile of buy orders (stops of shorts plus breakout buyers), and the area under an obvious low holds a pile of sell orders. That pile is what traders call liquidity: a pool of orders that can absorb or fuel a large move.
Where do the stops rest?
The most common places:
- Beyond a clear swing high or swing low. The more candles that respected it, the more orders cluster behind it.
- Beyond equal highs or equal lows. Two or more tops at the same price look like a ceiling; stops pile up right above them. See equal highs and lows.
- Beyond the previous day's or previous week's high and low. Many traders mark them.
- Beyond the edges of a range. Everyone sees the box, and everyone puts orders just outside it.
What exactly is a sweep?
A sweep has three parts, and all three must be there:
- A clear level exists: a recent swing high or swing low.
- A candle's wick goes beyond that level.
- The same candle closes back inside, on the original side.
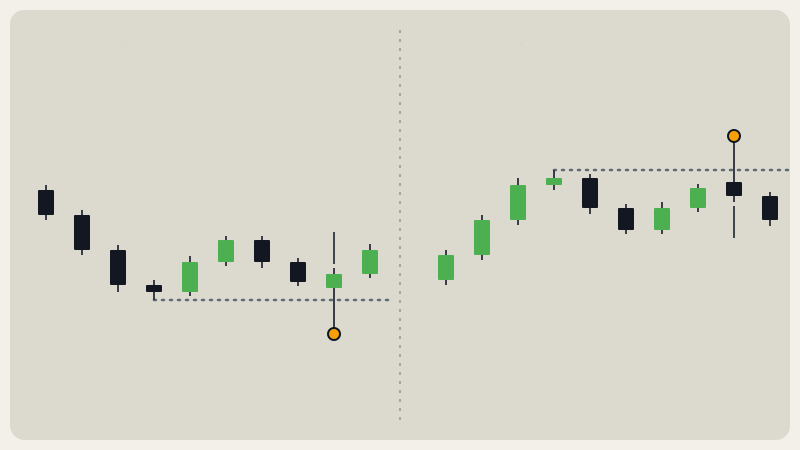
The wick is the visible trace of orders being triggered. Price reached out, took what was resting there, and could not hold the new territory by the close. That failure to close beyond the level is the whole tell.
Bullish sweep and bearish sweep
- Bullish sweep (low swept): wick below a swing low, close back above it. Sell-side orders (stops of longs, breakout sells) were taken.
- Bearish sweep (high swept): wick above a swing high, close back below it. Buy-side orders (stops of shorts, breakout buys) were taken.
The names describe which way the idea leans, not what price will do.
Sweep vs breakout: what is the difference?
The only difference is the close. If the candle body closes beyond the level, the level broke. If only the wick went beyond and the close is back inside, it was swept.
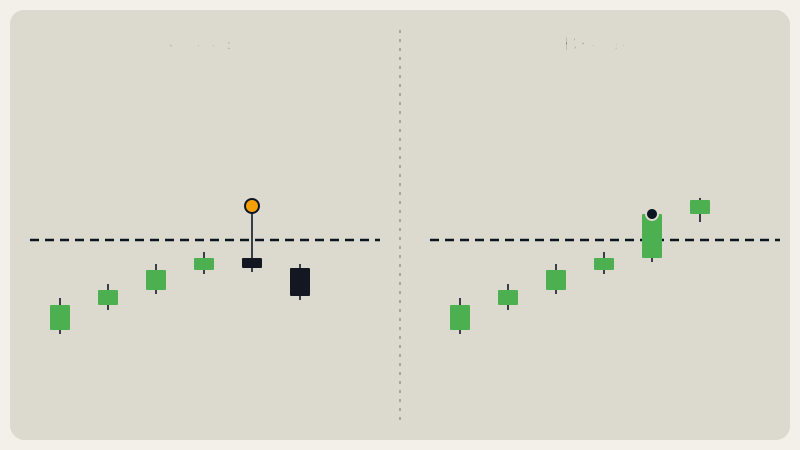
This matters because the two call for opposite plans. A close beyond the level says the market accepted the new price; the next step is usually a retest or continuation, which is the topic of BOS vs CHoCH. A close back inside says the market rejected the new price. Which candle you wait for decides which trade you are planning.
A practical caution: on a 4H chart, a candle that is still forming can look like a sweep and become a break by the close. Judge sweeps on closed candles only.
How do you spot a sweep on a chart?
- Mark the level first. Find the last clear swing high or low, or an equal high/low. Draw a horizontal line. No level, no sweep.
- Find the wick. Look for a candle whose high (or low) is beyond the line.
- Read the close. Is the body back on the original side of the line? If yes, candidate sweep. If the body closed beyond, it is a break.
- Check the next candle or two. If they also close beyond the line, the sweep failed and you are looking at a breakout in progress.
- Note the context. Is the sweep happening into a level you already care about, in line with the higher timeframe? A sweep in the middle of nowhere is less informative.
Why a sweep is a condition, not a trigger
A sweep says that resting orders were just consumed. It does not say who will control price next. There are two common continuations:
- Reclaim and reverse: price closes back inside, then moves away from the swept level. The orders that fueled the wick are gone, and price is free to go the other way.
- Sweep as first step: price closes back inside once, then breaks the level on a later candle. The wick was a probe, and the real move follows through.
You cannot tell which one you are in from the wick alone. That is why a sweep goes in the "conditions" column of your plan, together with a structure shift and a level, and never alone in the "entry" column.
Honest note: A sweep does not guarantee a reversal. Sometimes it is only the first leg of a breakout, and the most common way to misuse the idea is to treat every wick through a level as a turning point. Treat it as a reason to pay attention and to wait for confirmation.
How do you use a sweep in a plan?
Write it as if/then, with a price at which you are wrong:
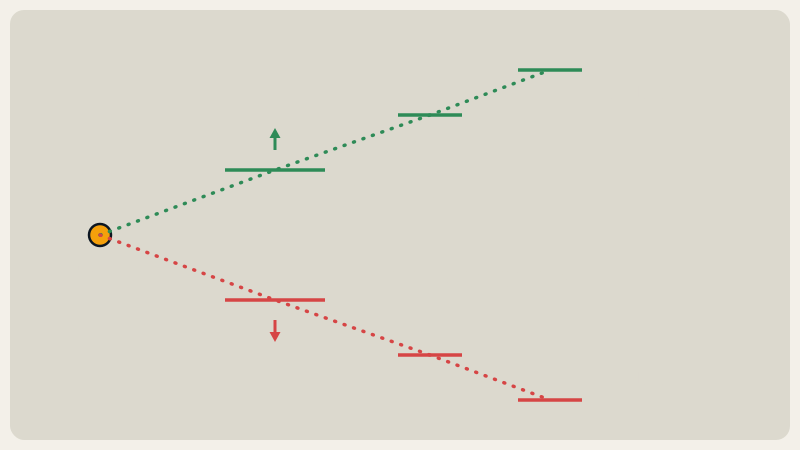
- If price sweeps the low at 100 (wick to 98, close at 101) at a level I already care about, and a lower timeframe shifts structure up afterwards, then I can consider a long idea with my stop under the wick low at 98.
- If instead the next 4H candle closes below 100, then the sweep failed, the level broke, and the idea is off.
The numbers are made up for illustration. The structure is what matters: a trigger, a confirmation, an invalidation. Confirmation can be a structure shift on a lower timeframe, a reclaim of a key level, or a candle pattern at the zone. See trading scenarios and invalidation for a full template.
What invalidates a sweep idea?
- A close beyond the swept level on your trading timeframe (the sweep turned into a break).
- A close beyond the protective swing that the idea rests on.
- A higher timeframe pushing hard against your direction. A bullish sweep against a strong 1D downtrend has less room.
- No reaction: price sits at the level for several candles without moving away. The "reclaim" never happened.
Common traps
- Calling every wick a sweep. The wick must pass a meaningful, visible level. A tiny wick through a minor swing in a noisy range is just noise.
- Entering on the wick. The wick looks like the best entry only in hindsight. While it forms, it looks like a break.
- Ignoring the timeframe. A 5-minute sweep under a 4H support is a different event from a 4H sweep.
- Trading it against a strong trend. In a persistent move, sweeps of counter-trend swings often fail.
- No invalidation. If you cannot say where the idea is wrong, you do not have an idea yet.
In Chart Radars: a sweep is flagged when a wick within the last 3 candles goes beyond a recent swing point (found in the last 40 candles) and the candle closes back inside. If the body closes beyond the swing point, the engine treats it as a break, not a sweep. Swing points are confirmed pivots (3 candles on each side), and distances are measured in ATR so the rule works for any coin.
Real examples
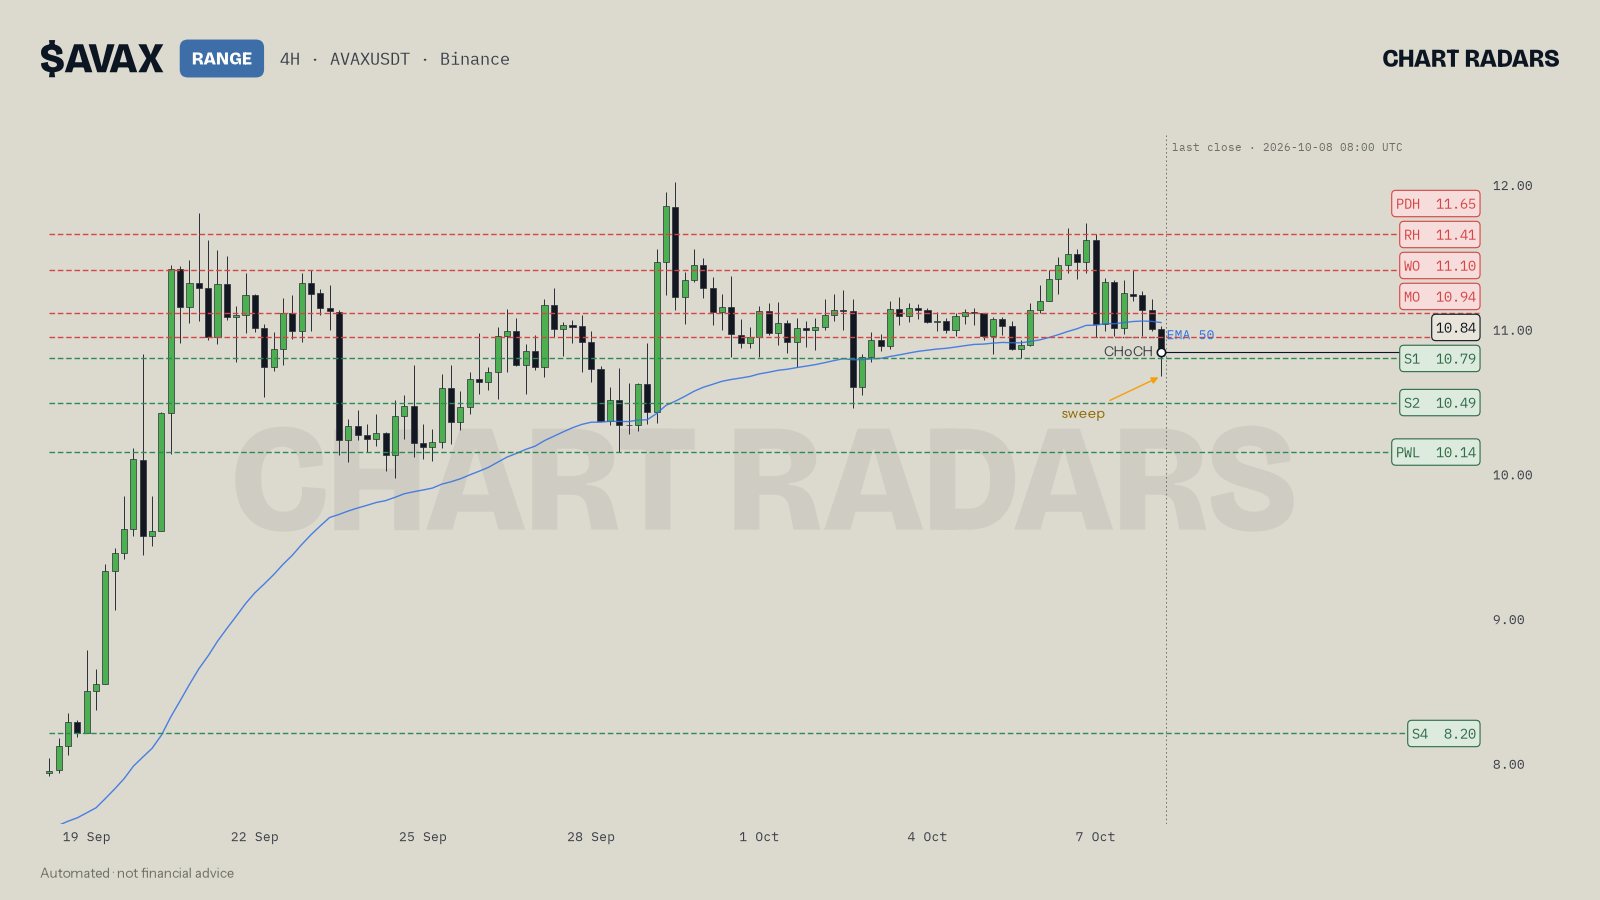
On AVAX 4H, 8 Oct 2026 (candle opened at 04:00 UTC), the chart marks a sweep of the low at 10.79, a level tested 4 times. The last candle's wick went under the level and the candle closed at 10.84, above it. The read stayed neutral: 4H bearish, 1D and 1W bullish, price inside a range of 10.79 to 10.94. It framed two conditional paths: a long only after a sweep and reclaim of 10.79, or a short only after a rejection at the 10.94 monthly open, and it would treat a 4H close below 10.79 as a range break to the downside. Notice what is on the chart and what is not: a sweep is there, a confirmation is not yet.
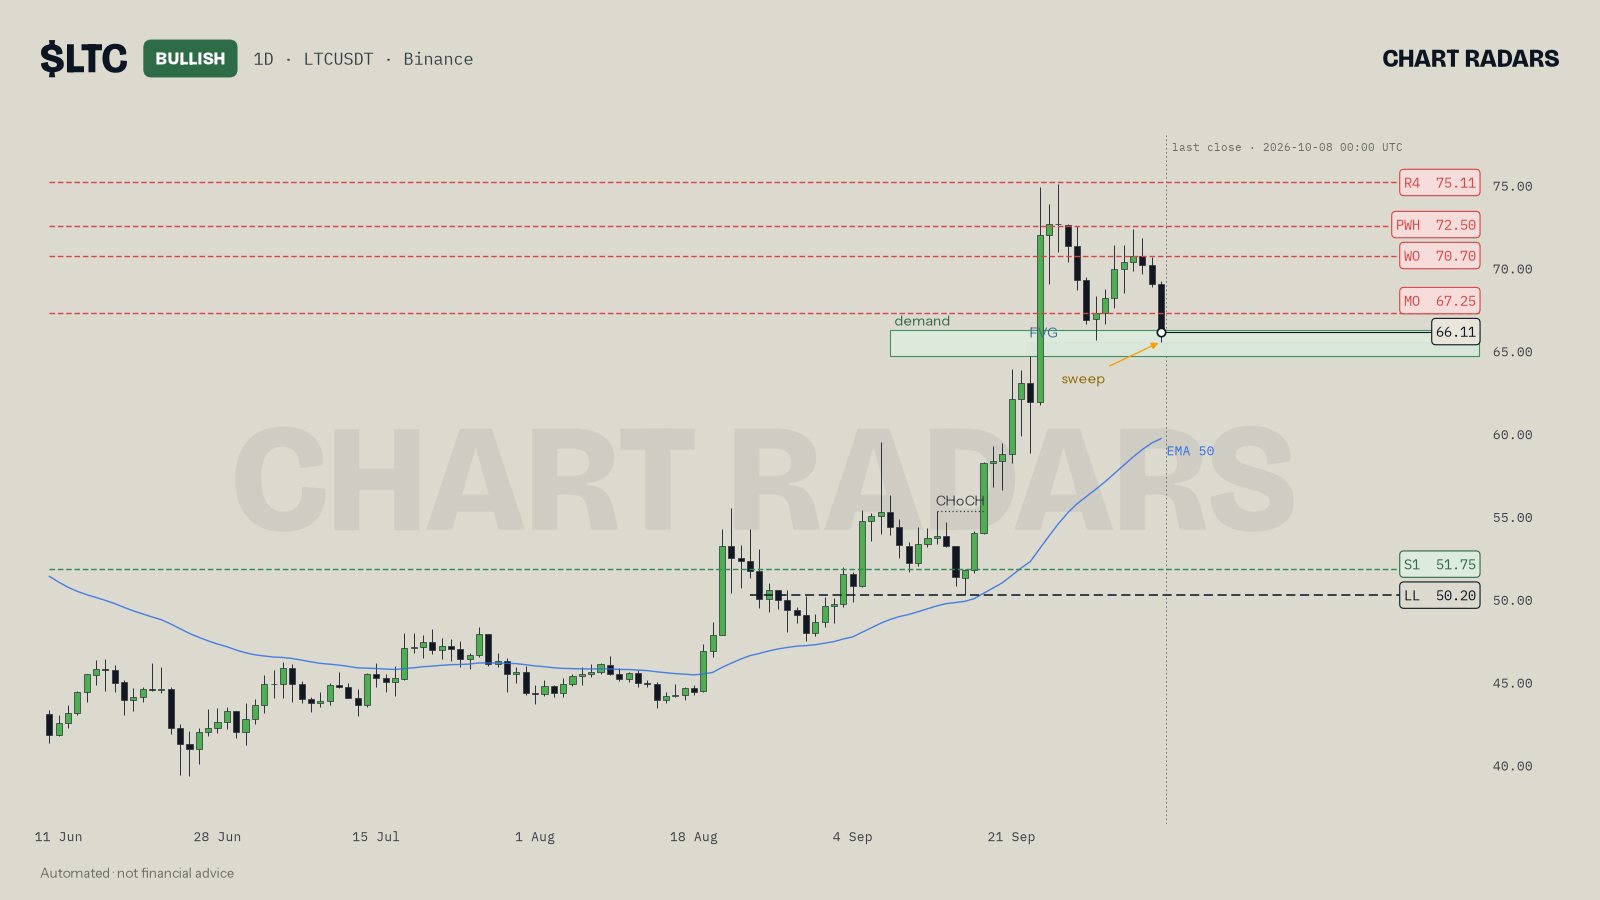
On LTC 1D, 8 Oct 2026, the sweep is marked at 65.63, inside a 64.64 to 66.22 zone where a demand area and a fair value gap overlap (see fair value gap). The close was 66.11. The read was bullish with the protective swing at 50.20, but it also asked for more before acting: a long lower wick, a bullish engulfing, or a 5m/15m structure shift. The sweep was a reason to look at the zone, not a reason to act on its own.
Key takeaways
- Liquidity is clusters of resting orders: stop-losses and breakout entries beyond obvious highs and lows.
- A sweep is a wick through a level with a close back on the original side. A body close beyond is a breakout.
- A sweep is a condition. It becomes useful only with a level, a confirmation and a stated invalidation.
- Judge sweeps on closed candles, on a timeframe that matches your plan.
- If the next candles close beyond the level, the sweep failed. Accept that quickly.
Frequently asked questions
Is a liquidity sweep bullish or bearish?
It depends on the side that was swept. A wick below a low that closes back above it is a bullish sweep; a wick above a high that closes back below it is a bearish sweep. Either one is a condition to watch, not a prediction.
What is the difference between a liquidity sweep and a breakout?
In a sweep the wick goes through the level but the candle closes back inside. In a breakout the candle body closes beyond the level. The close is what separates the two.
How do you know if a liquidity sweep is real?
Check that the wick passed a clear swing high or low, that the same candle closed back on the original side, and that the next candles do not close beyond the level. If they do, it was a break, not a sweep.
Do liquidity sweeps always reverse price?
No. A sweep shows that resting orders were taken, nothing more. Price can turn, stall, or keep going and turn the sweep into the first step of a breakout.
Which timeframe is best for spotting liquidity sweeps?
Higher timeframes such as 4H and 1D produce fewer but cleaner sweeps, because more orders sit at those levels. Lower timeframes show more sweeps and more noise.