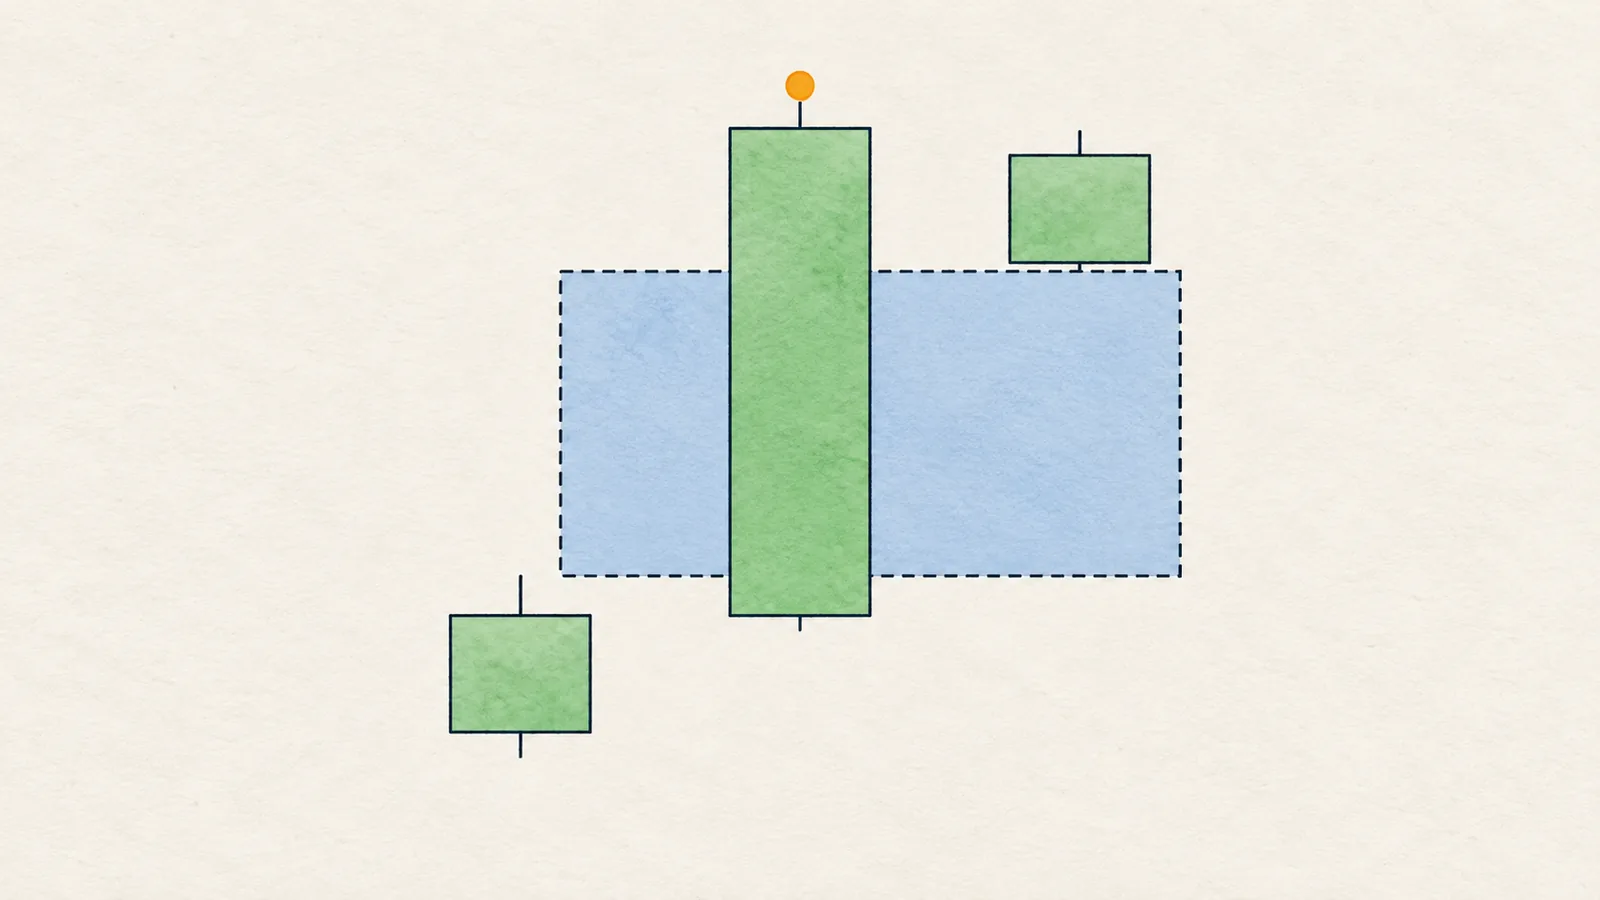
A fair value gap (FVG) is a three-candle price imbalance in which a strong middle candle moves so quickly that the high of the first candle and the low of the third candle (or the reverse) do not overlap. The empty stretch between them is the gap: a price area where little trading took place.
The idea behind it is simple. When price moves very fast, it skips over prices without letting both buyers and sellers trade there. Traders who use FVGs watch that skipped stretch as a possible place for price to react if it ever comes back. This guide shows exactly how to draw one, how to tell the useful ones from the noise, and how to use it in a plan.
What is a fair value gap?
Look at three consecutive candles. In a sharp rally, candle 2 is large and green. Candle 1 (before it) has a high. Candle 3 (after it) has a low. Normally candle 1's range and candle 3's range overlap a little, because the move had to pass through those prices somewhere. In an FVG they do not: candle 3's low is above candle 1's high, and there is empty space between them.
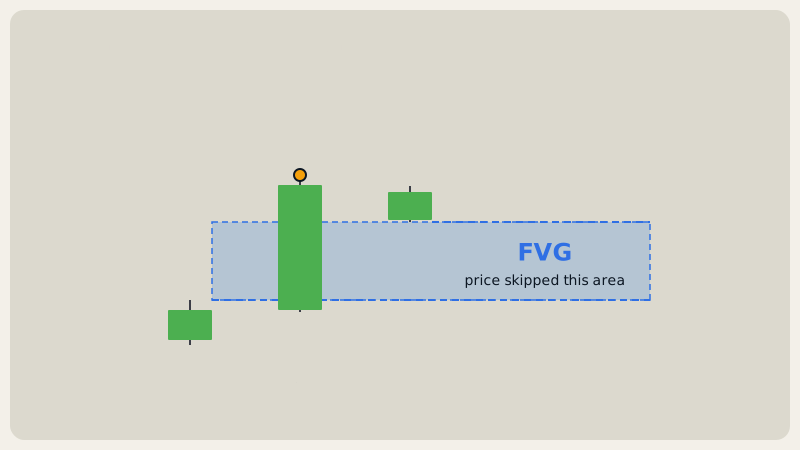
The middle candle's body crosses that space almost entirely on its own. Both sides did not get a fair chance to trade there, hence the name. Nobody knows what "fair value" is; it is only a label for the unbalanced stretch.
How do you draw a fair value gap exactly?
Use the wicks of candles 1 and 3. Not the middle candle, and not the bodies.
Bullish FVG (strong move up): 1. Take three candles in a row, where candle 2 is a strong up move. 2. The top of the gap is the low of candle 3. 3. The bottom of the gap is the high of candle 1. 4. It is valid only if candle 3's low is above candle 1's high.
Bearish FVG (strong move down): 1. Candle 2 is a strong down move. 2. The top of the gap is the low of candle 1. 3. The bottom of the gap is the high of candle 3. 4. It is valid only if candle 3's high is below candle 1's low.
Draw a rectangle from the first candle's edge to the right, so you can see later whether price comes back. If the three candles' ranges overlap, there is no gap, however big candle 2 was.
Bullish vs bearish FVG
A bullish FVG is left by a strong move up. It usually sits below the current price, where it may act as a support area on a pullback. A bearish FVG is left by a strong move down. It usually sits above current price, where it may act as a resistance area on a bounce.
Some charts label a gap by where it sits relative to current price instead: a gap below price is called bullish and a gap above price bearish. In most cases the two naming systems agree, since an up move leaves its gap below price.
What are partial fills?
When price returns to the gap, it can do three things:
- Touch and react. Price enters the gap slightly, then turns. The gap did its job.
- Partial fill. Price enters part of the gap, then moves on or turns. The unfilled part still remains and the gap is now narrower.
- Full fill and through. Price closes beyond the whole gap. It is no longer an imbalance, and it is no longer useful as a zone.
Many traders watch the middle of the gap (its 50% level) as a reference point. This is a convention, not a law. What is more useful is to note what price does inside: a quick rejection with a wick suggests the zone is attracting reaction; slow, grinding candles that close deep into the gap suggest it is giving way.
When is an FVG meaningful, and when is it noise?
Almost every chart has dozens of small three-candle gaps. Most are not worth drawing. A more selective filter:
- Size relative to the coin. A gap should be a meaningful fraction of the coin's typical candle size. A tiny gap on a volatile coin is noise.
- Timeframe. An FVG on 4H or 1D reflects far more activity than one on 5-minute candles.
- Context. A gap left by a strong move that also broke structure matters more than one inside a sideways range.
- Location. A gap sitting alone in open space is less interesting than one that overlaps a level you already care about.
- Freshness. A gap that price has not returned to is clean. One that has been partly filled is weaker.
FVG plus level: the zone
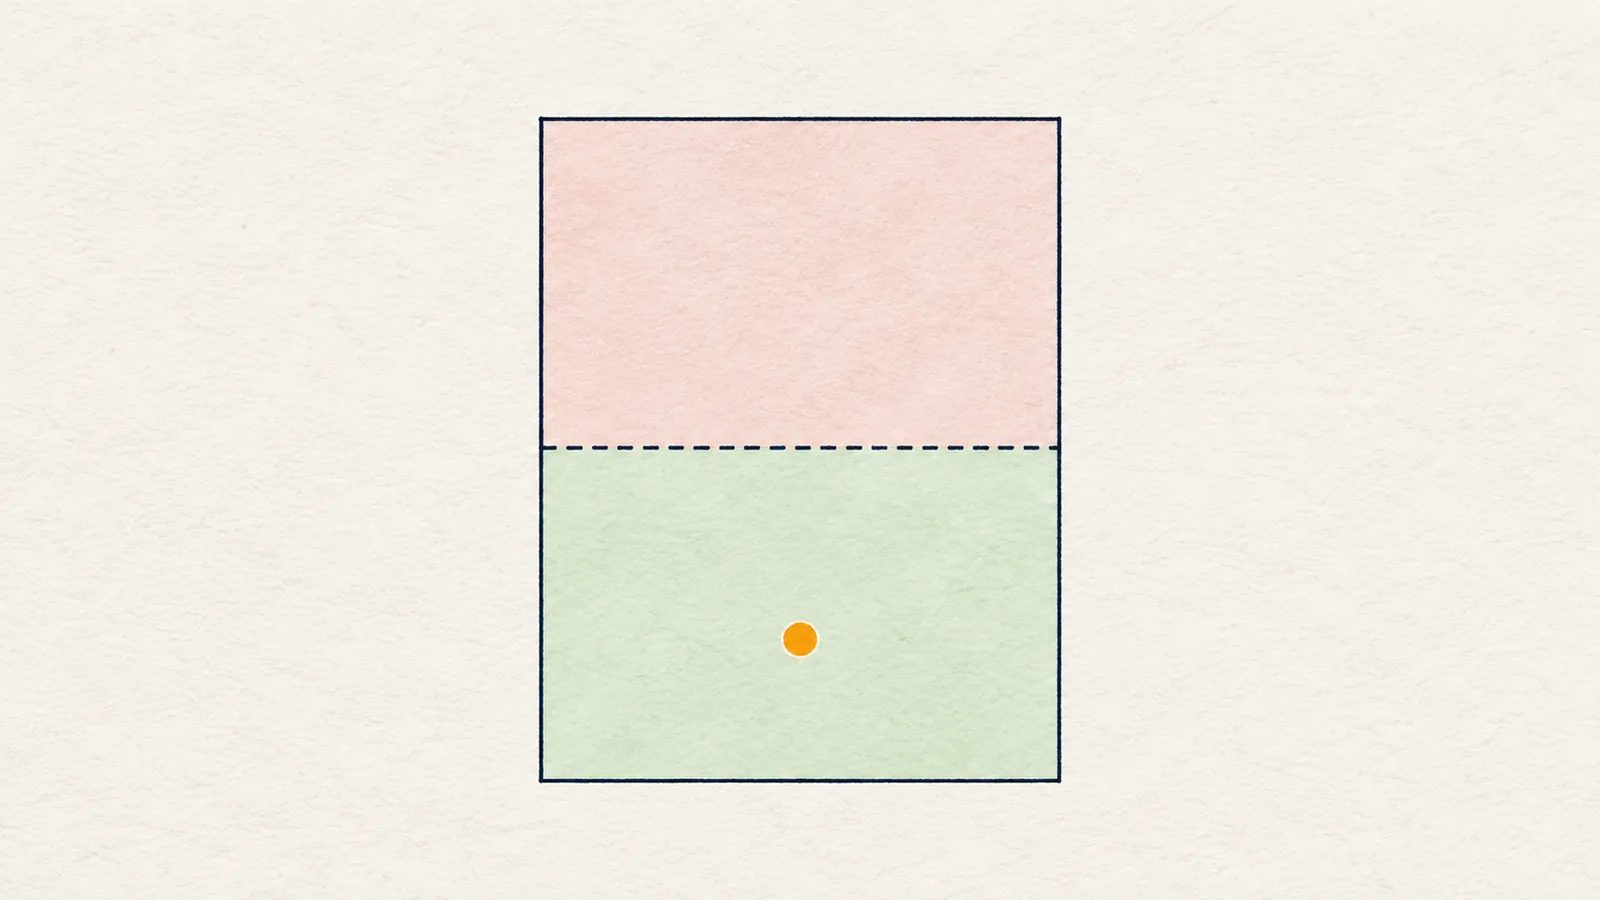
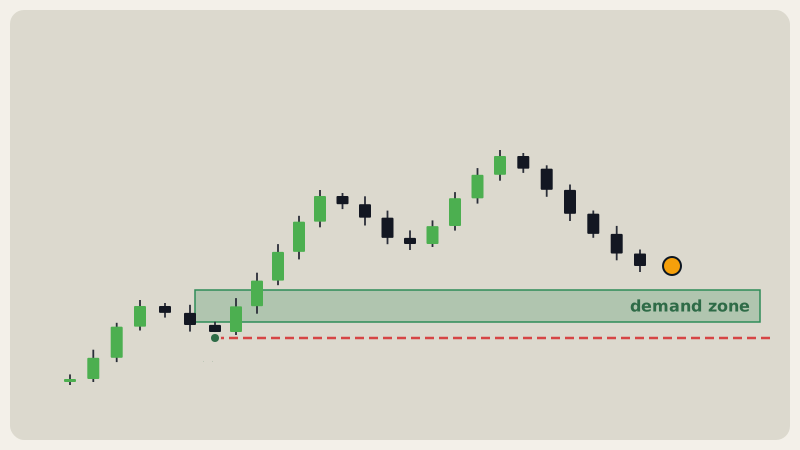
The strongest use of an FVG is as part of a zone, not on its own. When a gap overlaps a level you already marked (a prior-day high or low, a weekly open, a swing point), you get an area with two independent reasons to pay attention. It also gives you a range, not a single price, which fits how markets actually behave. See premium and discount for another way to judge whether a pullback zone is in a good half of the range.
How do you use an FVG in a plan?
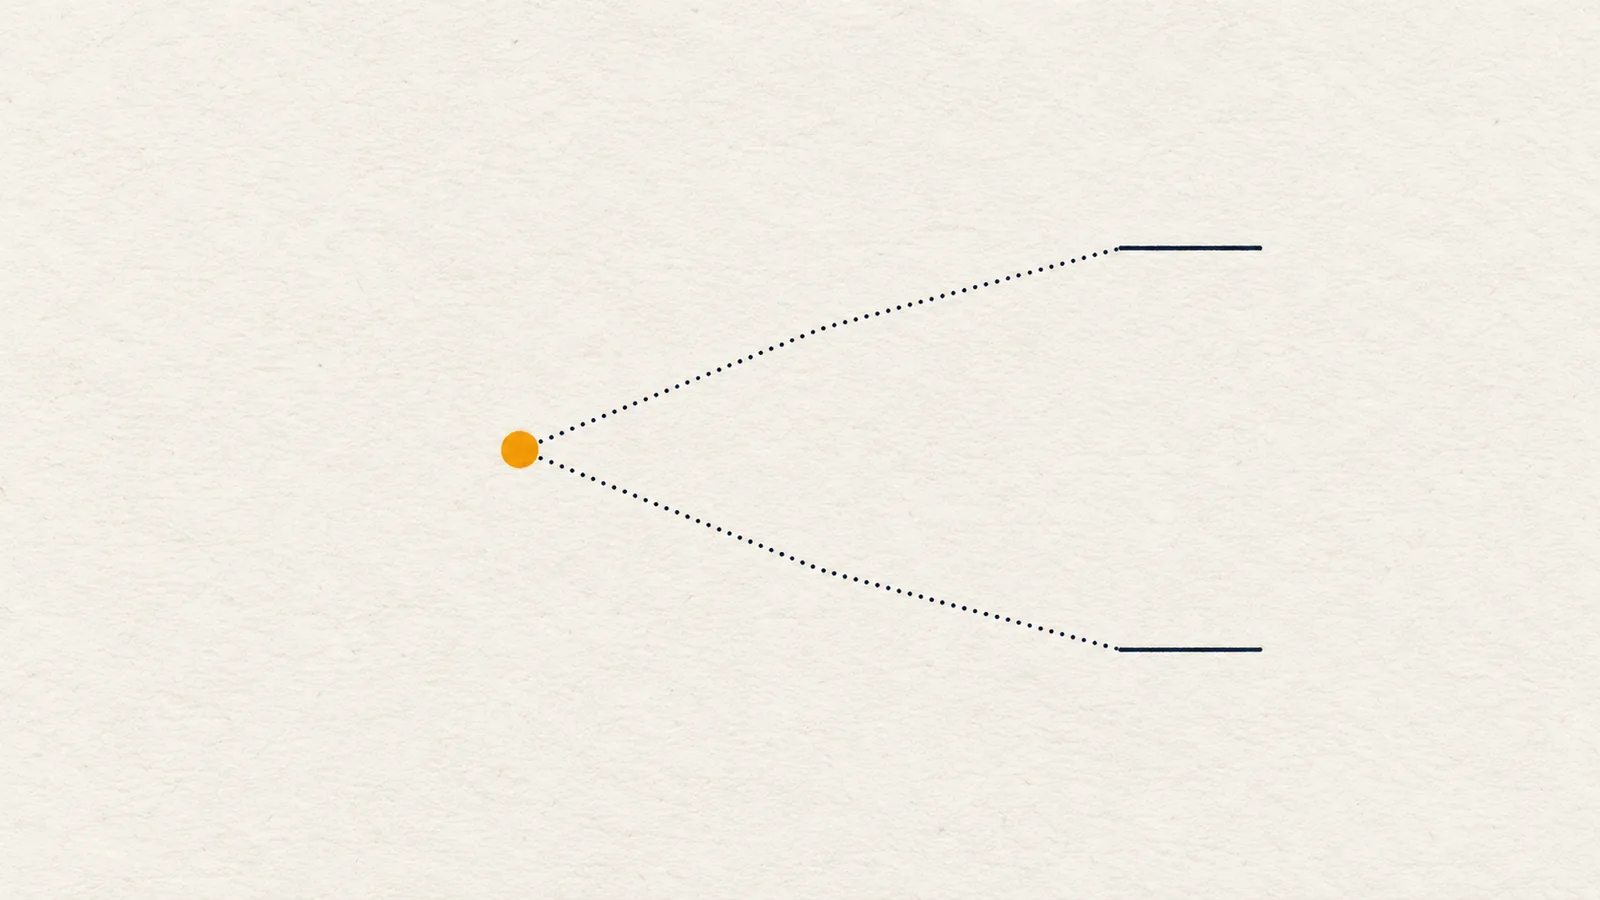
Always as if/then, with a place where the idea is wrong:
- If price pulls back into the gap between 100 and 102, which also overlaps a level I marked, and a lower timeframe shows a shift back up, then I consider a long idea with the idea wrong below the swing low that started the move.
- If a 4H candle closes below the whole gap, then the zone failed and I step aside.
These numbers are made up to show the structure. The gap alone is never the trigger. The reaction at the gap is. A sweep inside the gap, for instance, can be the confirmation you were waiting for (see liquidity sweep). For a complete template, see trading scenarios and invalidation.
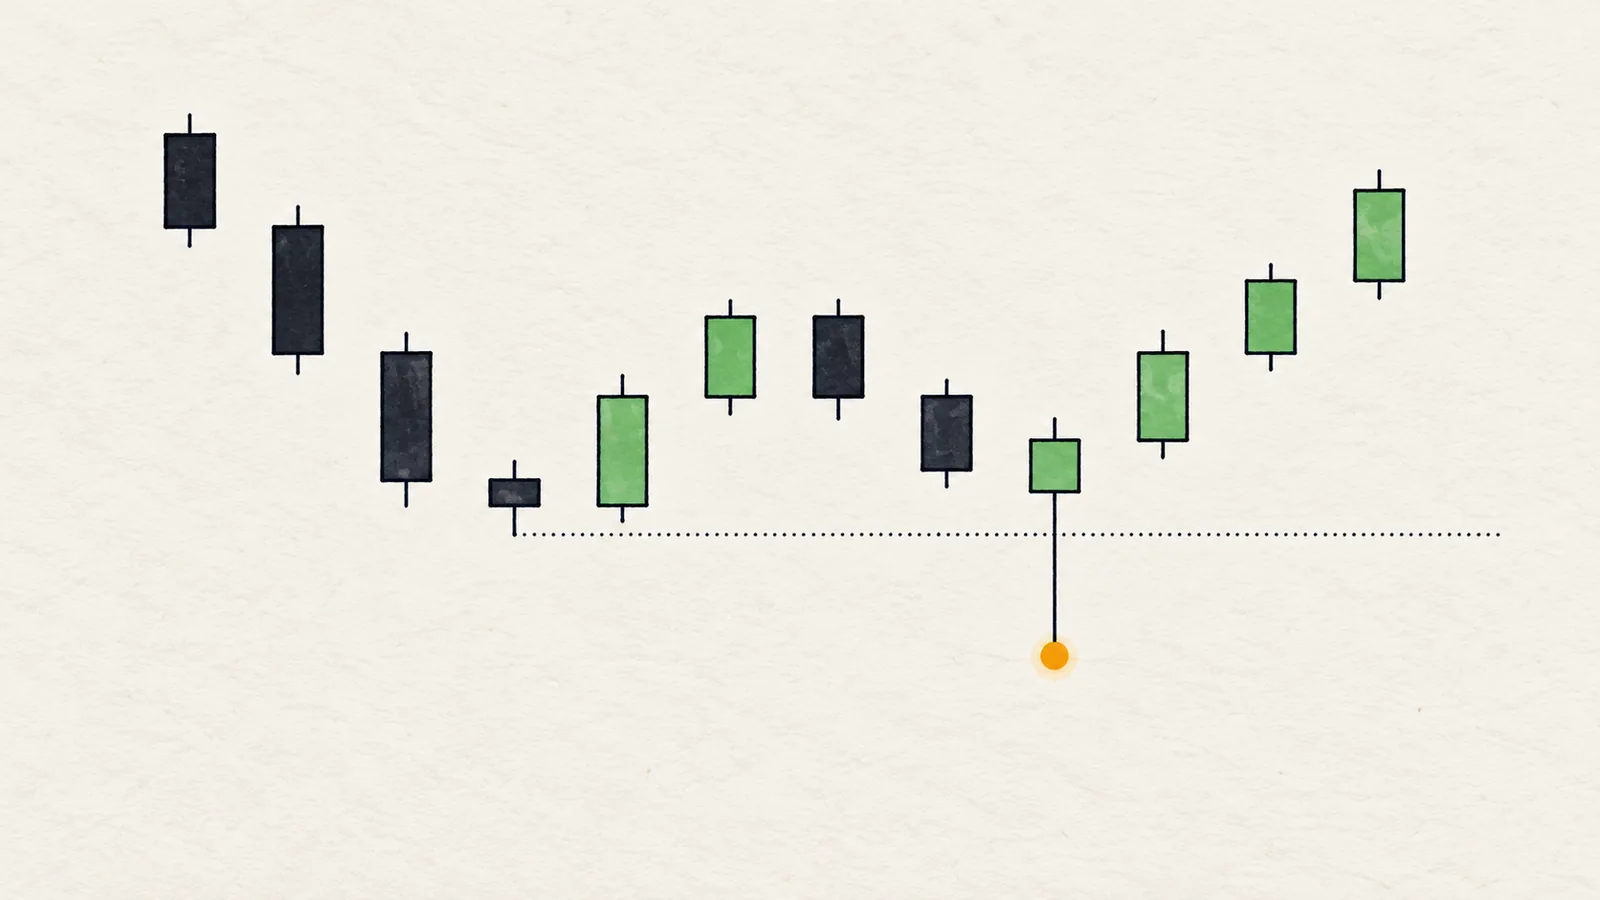
Honest note: A fair value gap is not a magnet. Price frequently ignores gaps for good, and gaps get filled only because price moves around so much that it eventually crosses most levels. Treat a gap as an area where reaction is possible, not as a promise that price will return or bounce.
Common traps
- Drawing gaps on every three candles. More boxes do not mean more information. Filter by size and context.
- Using the bodies instead of the wicks. The gap is between candle 1 and candle 3's wicks.
- Trading a filled gap. Once price has closed through it, it is no longer an open imbalance.
- Treating a gap as a trade. A gap is a zone. The entry needs a reaction and the plan needs an invalidation.
- Mixing timeframes. A 15-minute gap inside a 4H gap is a detail, not a separate idea.
In Chart Radars: a fair value gap is a three-candle gap at least 0.25 ATR wide, found in the last 60 candles, drawn between the high of candle 1 and the low of candle 3 for a bullish gap. The box shrinks as later price action fills it. The engine labels a gap by position: below price is bullish, above price is bearish. For pullback zones, the engine combines an open FVG and/or the nearest level (within 0.2 ATR) into one area, at most 5 ATR from price and never beyond the protective swing.
Real examples
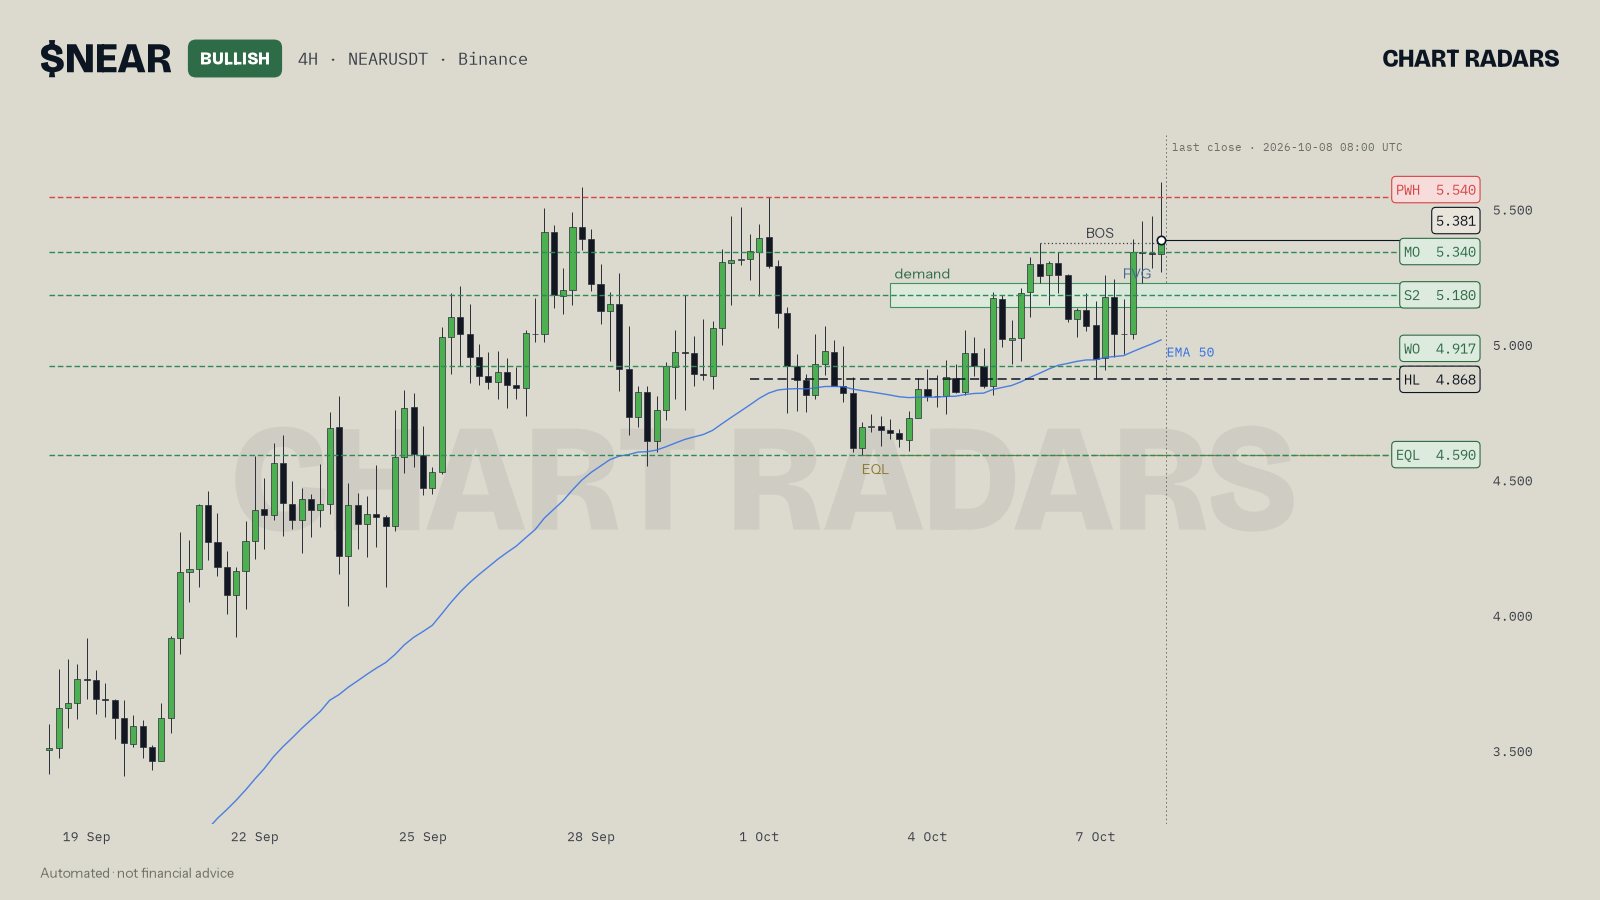
On NEAR 4H, 8 Oct 2026 (candle opened at 04:00 UTC), the chart shows a bullish FVG between 5.163 and 5.225, below the 5.381 close. The read was bullish and named a pullback zone of 5.135 to 5.225 (demand plus FVG), so the gap and a demand area overlap. It added two conditions: a wick under the local lows is fine as long as the 4.868 higher low holds, and since 15m was still shifting down, it wanted to see that turn back up before touching a long. That is the full use of a gap: a zone, a confirmation, a protective level.
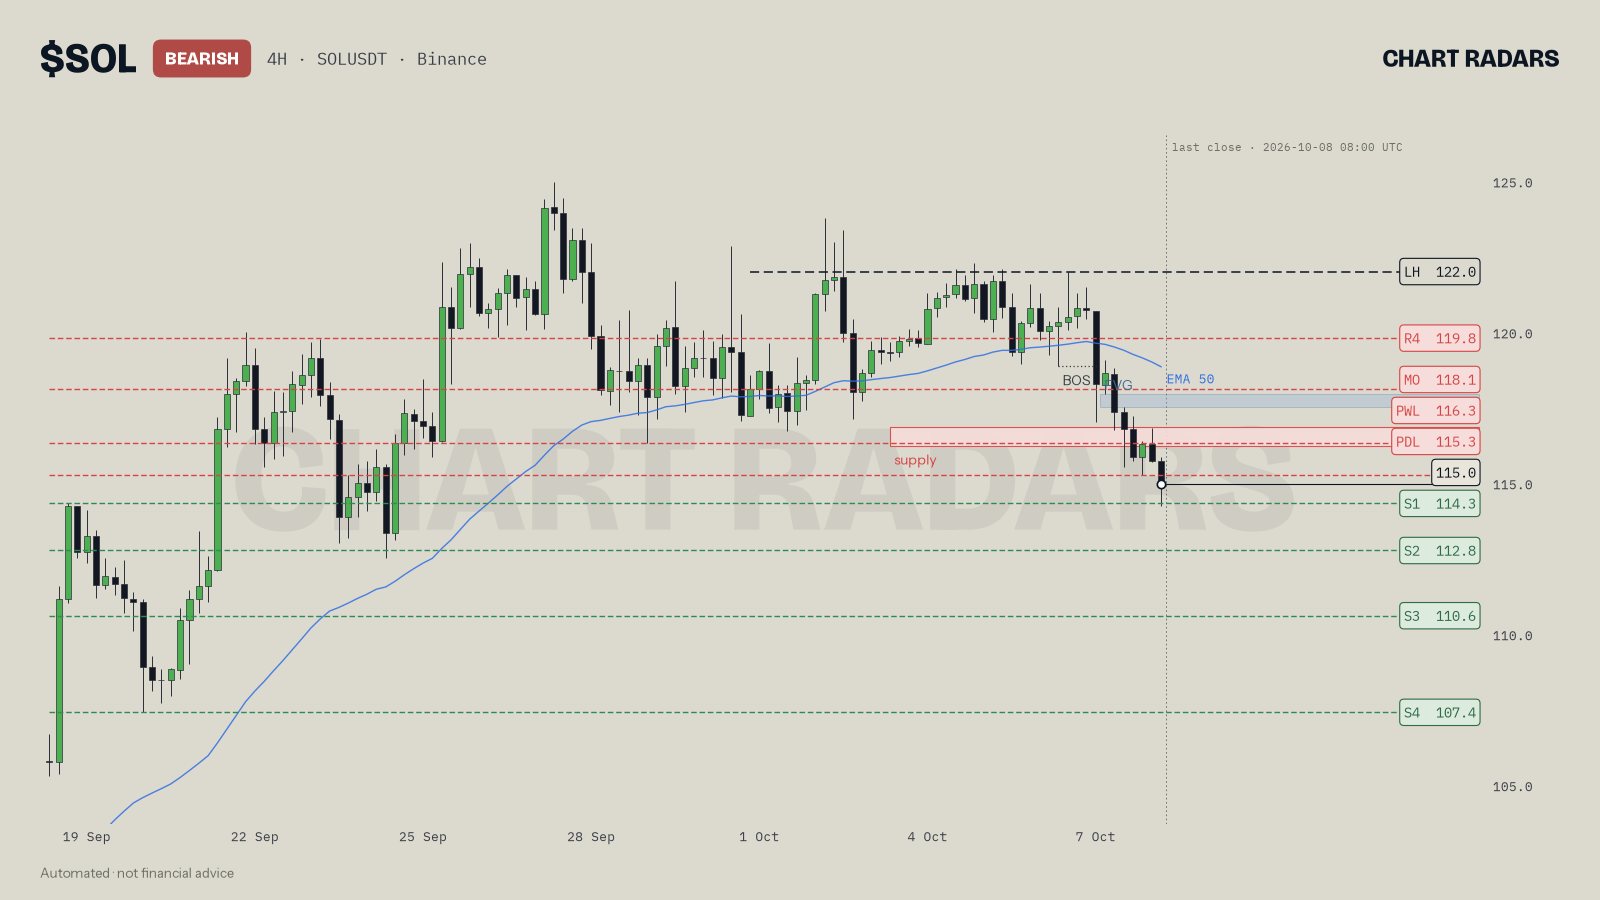
On SOL 4H, 8 Oct 2026, the gap is the opposite case: a bearish FVG between 117.5 and 117.94, above the 115.0 close. The read was bearish and preferred a short zone of 116.2 to 116.8 (supply), with the idea void on a 4H close above 122.0. The gap sits above the supply zone, just under the 118.1 monthly open, so a bounce would meet it after the zone. It is a good reminder that an FVG is one input among several, not the whole thesis.
Key takeaways
- An FVG is a three-candle gap between the wick of candle 1 and the wick of candle 3, left by a fast middle candle. No overlap, no gap.
- Bullish gaps are left by up moves and usually sit below price; bearish gaps are left by down moves and sit above.
- Partial fills are normal. A close through the whole gap ends it.
- Size, timeframe, context and overlap with a level separate meaningful gaps from noise.
- Use the gap as a zone in an if/then plan, with a confirmation and a clear invalidation.
Frequently asked questions
What is a fair value gap in trading?
A fair value gap (FVG) is a three-candle pattern where a strong middle candle moves so fast that the first candle's range and the third candle's range do not overlap. The unoverlapped stretch is the gap, a price area traded very little.
How do you draw a fair value gap?
Take three consecutive candles. For a bullish FVG, draw from the high of the first candle to the low of the third. For a bearish FVG, draw from the low of the first candle to the high of the third. If the ranges overlap, there is no gap.
Does price always fill a fair value gap?
No. Many gaps are partly filled, filled completely, or ignored. A gap is an area to watch for a reaction, not a guarantee that price will return.
What is the difference between a bullish and a bearish FVG?
A bullish FVG is left by a strong upward move and usually sits below price, where it may act as support on a pullback. A bearish FVG is left by a strong downward move and usually sits above price, where it may act as resistance.
Is an FVG the same as a price gap?
Not exactly. A price gap is a break between one candle's close and the next candle's open, which is rare in 24/7 crypto. An FVG is a gap between the wicks of candle one and candle three, so it appears often.