Step 01
Data
Closed candles from 15m up to 1W: Binance for crypto, OANDA for FX, gold and indices. Crypto reads add funding, open interest and taker flow from futures. A candle that is still forming is never used.
Type a coin, EUR/USD or gold into the Telegram bot and Chart Radars reads the chart for you: the trend across timeframes, the levels that matter, two conditional scenarios and, for crypto, what the derivatives market is doing. Same rules every time. The decision stays yours.
No AI improvises in the live flow. Fixed rules read closed candles, and reviewed templates put the result into words, the same way for every coin.
Closed candles from 15m up to 1W: Binance for crypto, OANDA for FX, gold and indices. Crypto reads add funding, open interest and taker flow from futures. A candle that is still forming is never used.
A trend only counts when structure, distance from the 50 EMA and its slope agree. Levels have names: weekly, daily and monthly opens, prior highs and lows, levels tested again and again.
Two conditional paths: what has to happen first, where it opens to and what would cancel it. When there is no edge, the read says so.
This is exactly what the bot sent for Bitcoin on the 4H chart. Price sat in the middle of a range, so the read found no edge there and said so, then mapped both edges.
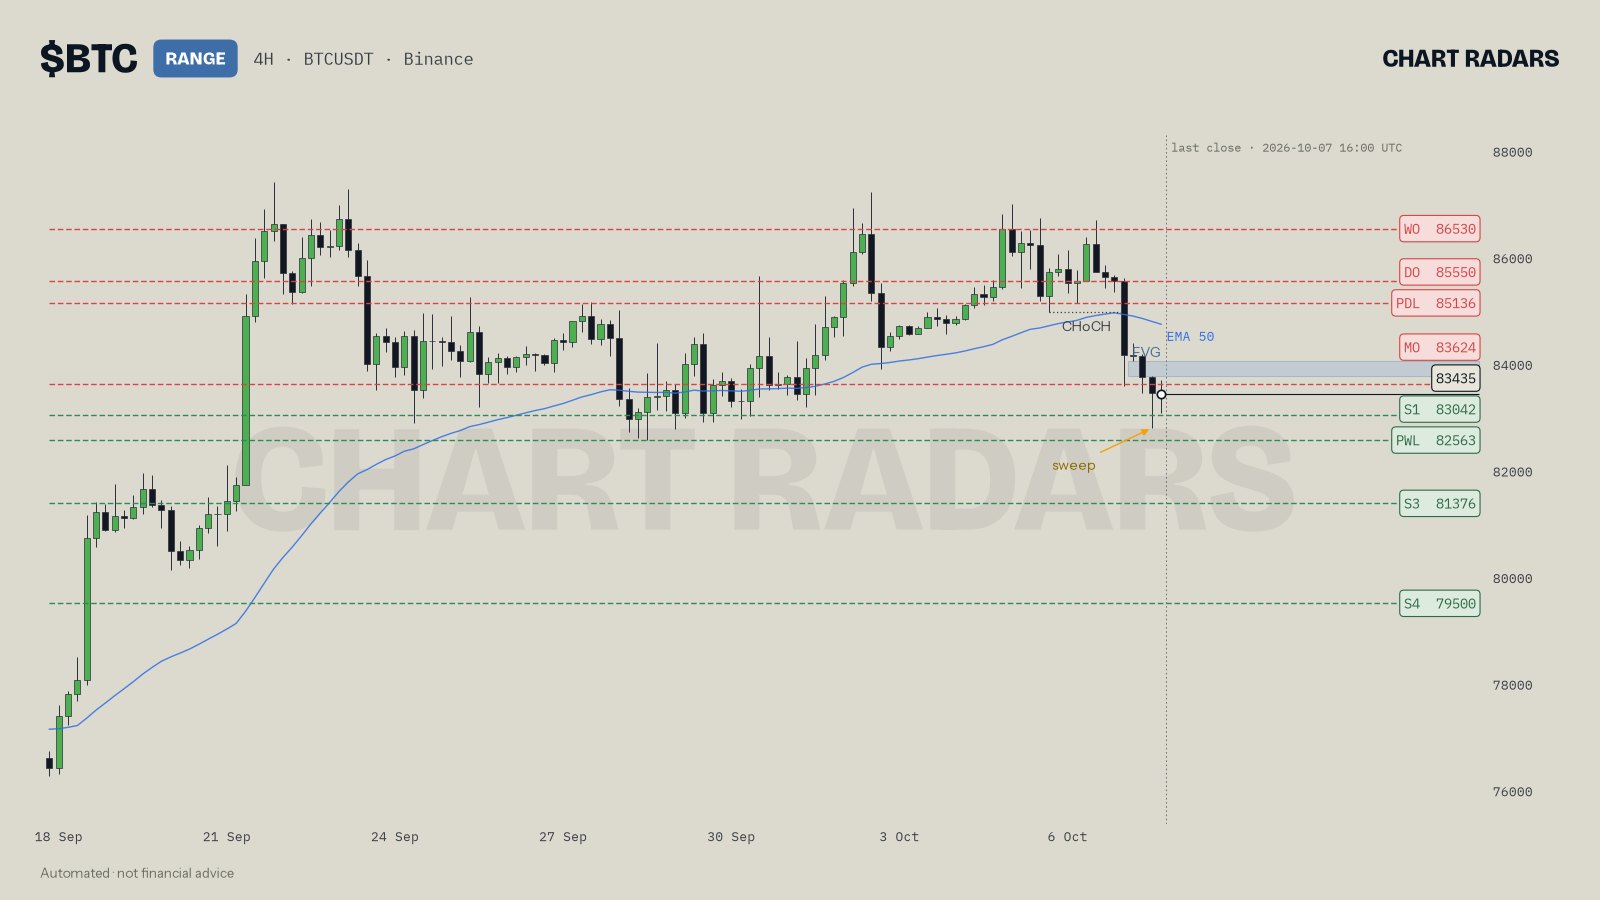

🧭 I don't see an edge on $BTC right now: the structure is split across timeframes (4H bearish · 1D bullish · 1W bullish), so the 4H chart looks more like a range than a trend.
📍 For context, price sits below the weekly open at 86530 and daily open at 85550.
↔️ With price stuck between 83042 and 83624 on 4H, I only want the edges: buy a sweep and reclaim of the 83042 level tested 4 times, or sell a rejection at the 83624 monthly open (tested 2 times).
📈 A 4H close above the 83624 monthly open (tested 2 times) would break the range to the upside and open the 85136 prior-day low, after that the 85550 daily open, after that ultimately the 86530 weekly open. Volume is about normal at 0.8× average, so I want to see it expand on the break. Sellers have had the upper hand in volume.
📉 Downside needs a 4H close under the 83042 level tested 4 times; then I would look toward the 82563 prior-week low, after that the 81376 swing low, after that ultimately the 79500 level tested 3 times.
📊 On the derivatives side, open interest is $8.0B (-1.7% in 24h), so positions are being closed more than opened. The rest of the flow: funding -0.0019%, takers 0.95×, L/S 1.68.
💡 I would rather miss a move than guess in the middle; the edges are where the odds improve.
Automated · not investment advice
Open 📡 Market scans in the bot, or type the command. Each scan comes back as an image with a short note and a shortcut to the full read of a coin.
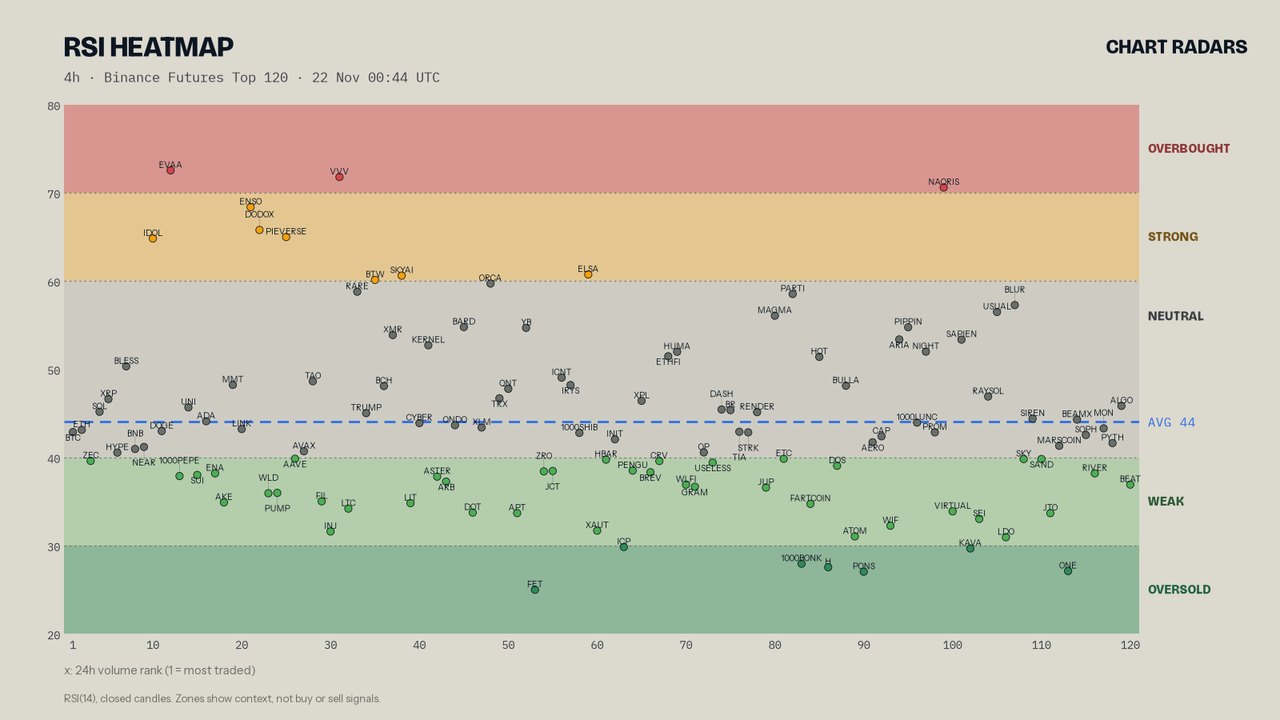
RSI heatmap of the 120 most traded Binance futures coins, sorted into five zones from oversold to overbought. Pick 15m, 1H or 4H. It names the hottest and coldest and which coins changed zone since the last scan. Zones are context, not signals.
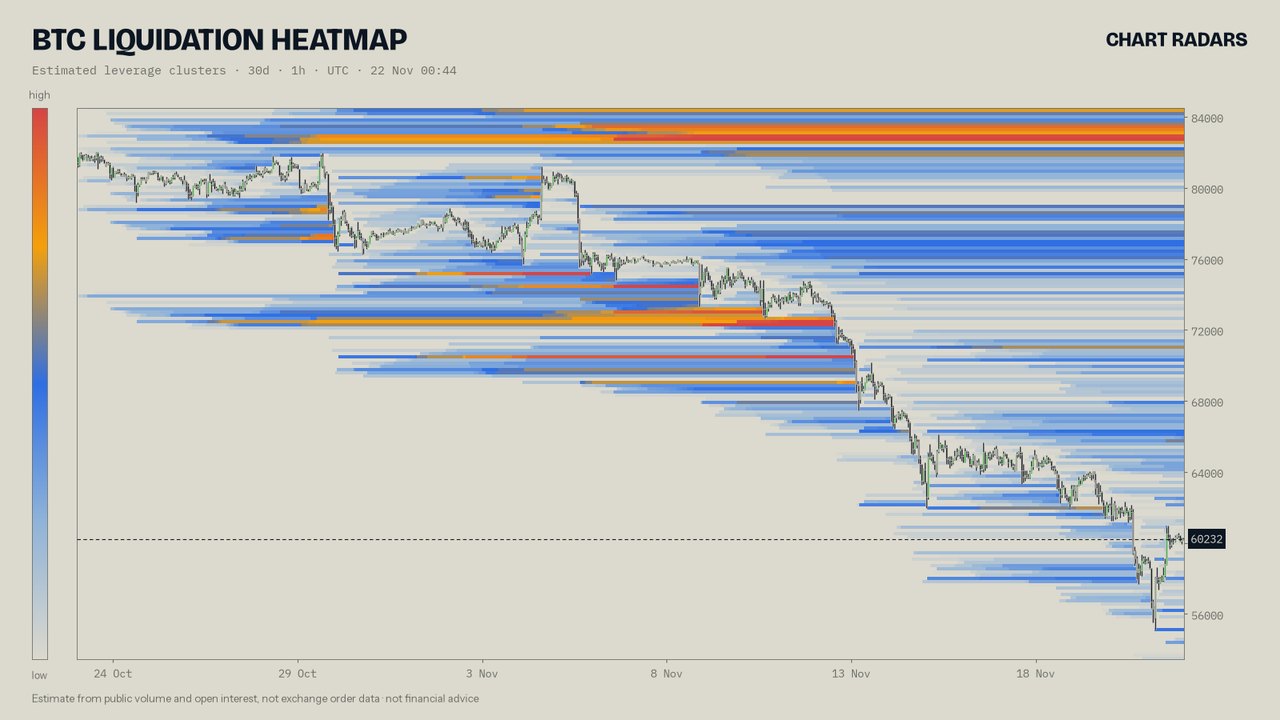
An estimated map of where leveraged positions could be liquidated, for any crypto coin, built from 30 days of 1H candles: /liqs sol. It is a model built from public volume and open interest, not exchange order data.
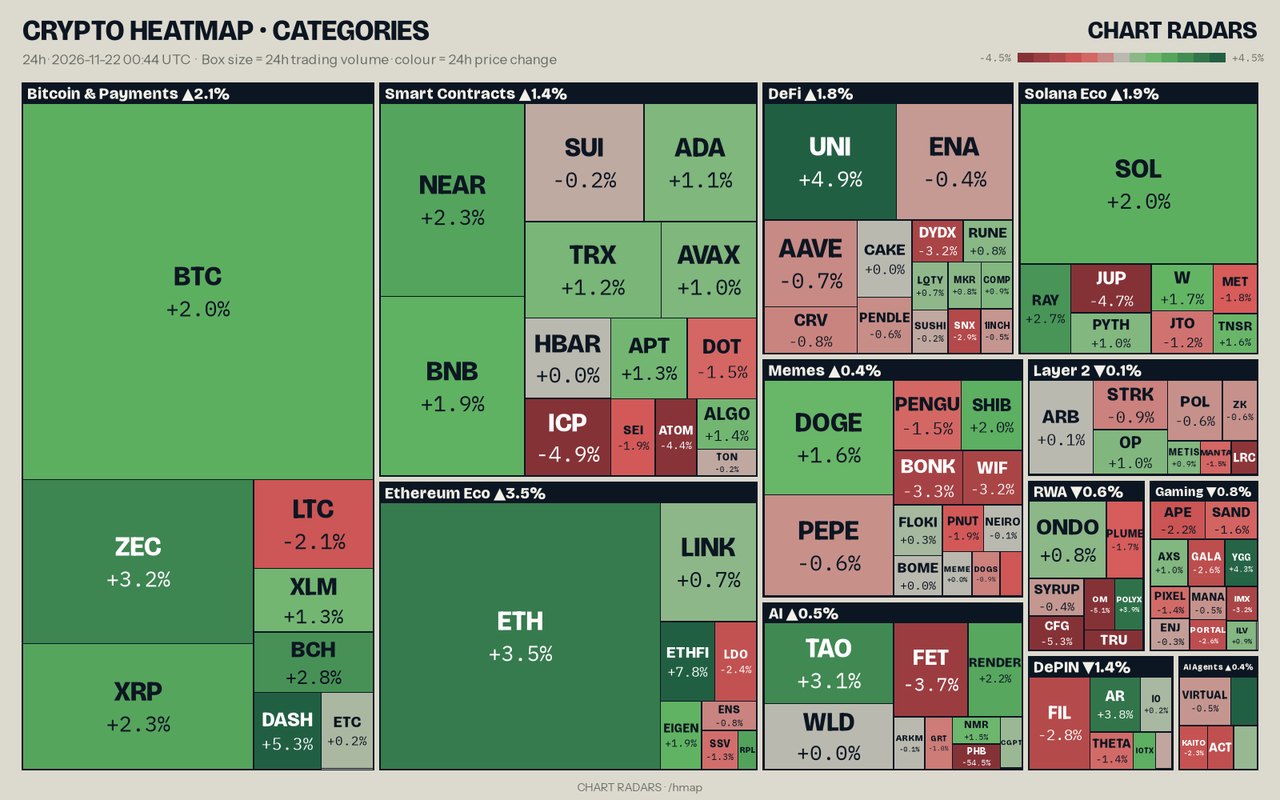
Crypto grouped by category: memecoins, AI, DeFi, Layer 2 and more. Box size is 24h volume, colour is 24h price change. It shows where money is moving, not what to buy.
Real bot output, unedited · · the liquidation map is an estimate
Turn the radar on and the bot keeps an eye on the most traded coins and the FX markets by itself. When a 4H candle closes with something worth a look, the read comes to you.
/scorecard in the bot shows how past reads played out.Yes, during the beta. Seats are limited: when they are all taken, the bot puts you on a waitlist and messages you when one opens.
Any USDT pair on Binance spot: type SUI, PEPE or LINK. Also nine FX and CFD markets via OANDA: EUR/USD, GBP/USD, USD/JPY, AUD/USD, USD/CAD, USD/CHF, gold (XAU/USD), NAS100 and US30. Type EURUSD, gold or nasdaq. FX reads have no derivatives line and no BTC comparison. The radar on its own watches the 20 most traded coins plus those nine.
15m, 1H, 4H, 1D and 1W. Type a coin alone for your default timeframe, or add one: LINK 15m, ETH 1w, EURUSD 4h. Under each read you can switch or refresh. Every read uses closed candles only.
The bot speaks English, Spanish, Brazilian Portuguese, Vietnamese and Indonesian: the menus, the charts and the reads. This website is in English, Spanish, Portuguese, Vietnamese and Indonesian.
No. The bot reads public market data only. You never connect an exchange or share a key.
No. Chart Radars is an automated chart-reading tool. It does not know your situation and it can be wrong. Decide for yourself and size your own risk.
Open @chartradarsbot on Telegram and type BTC. The first read takes a few seconds.
Open in Telegram