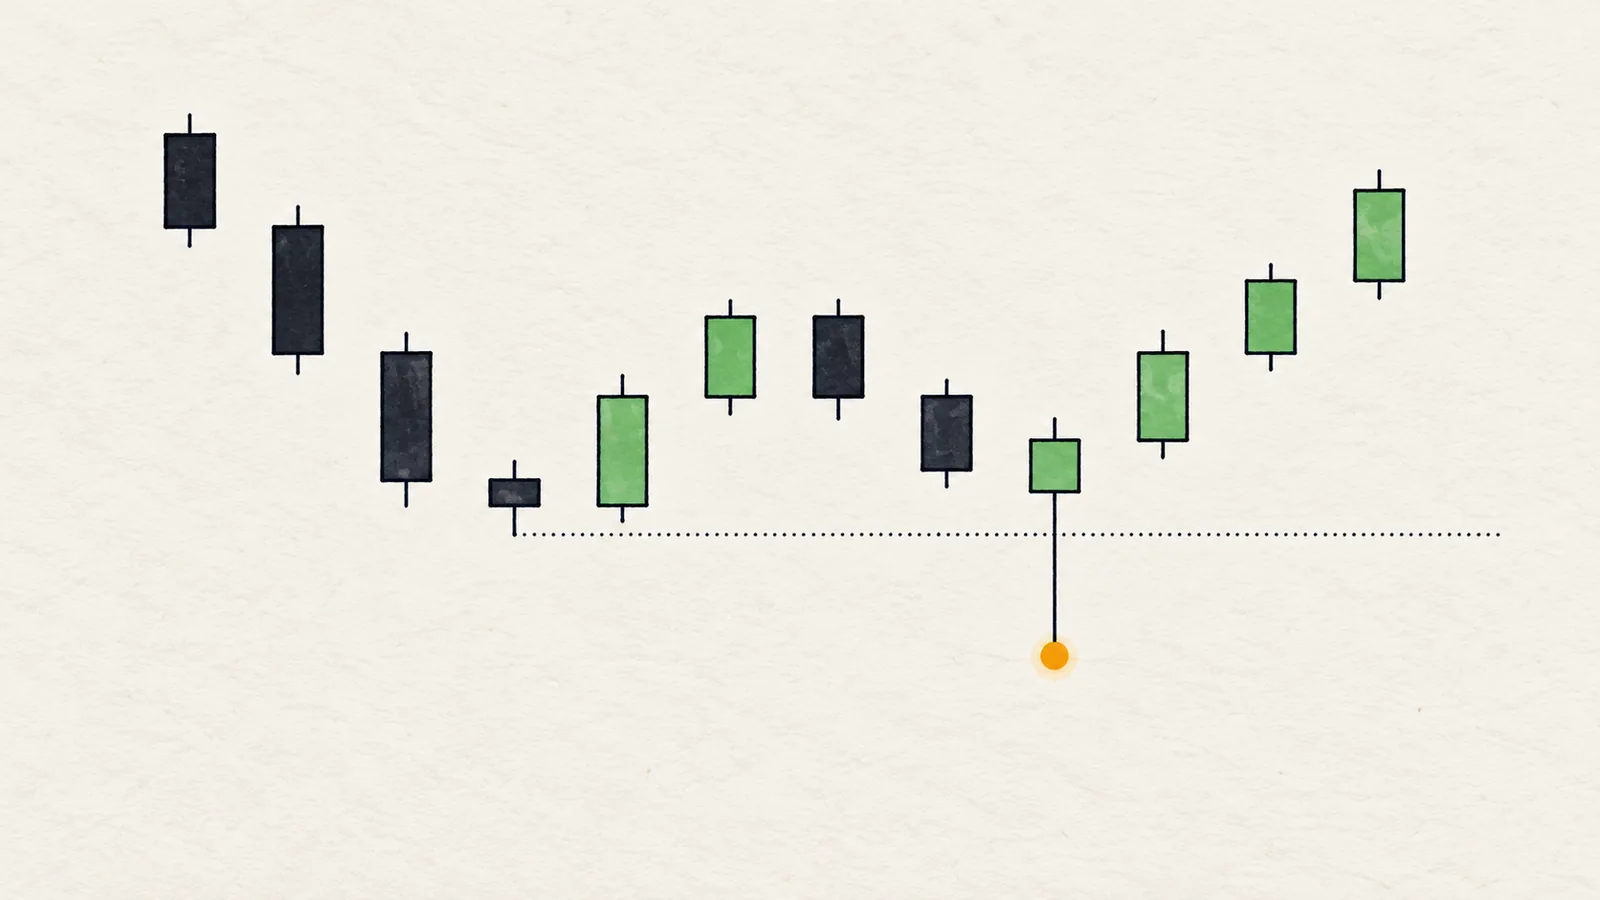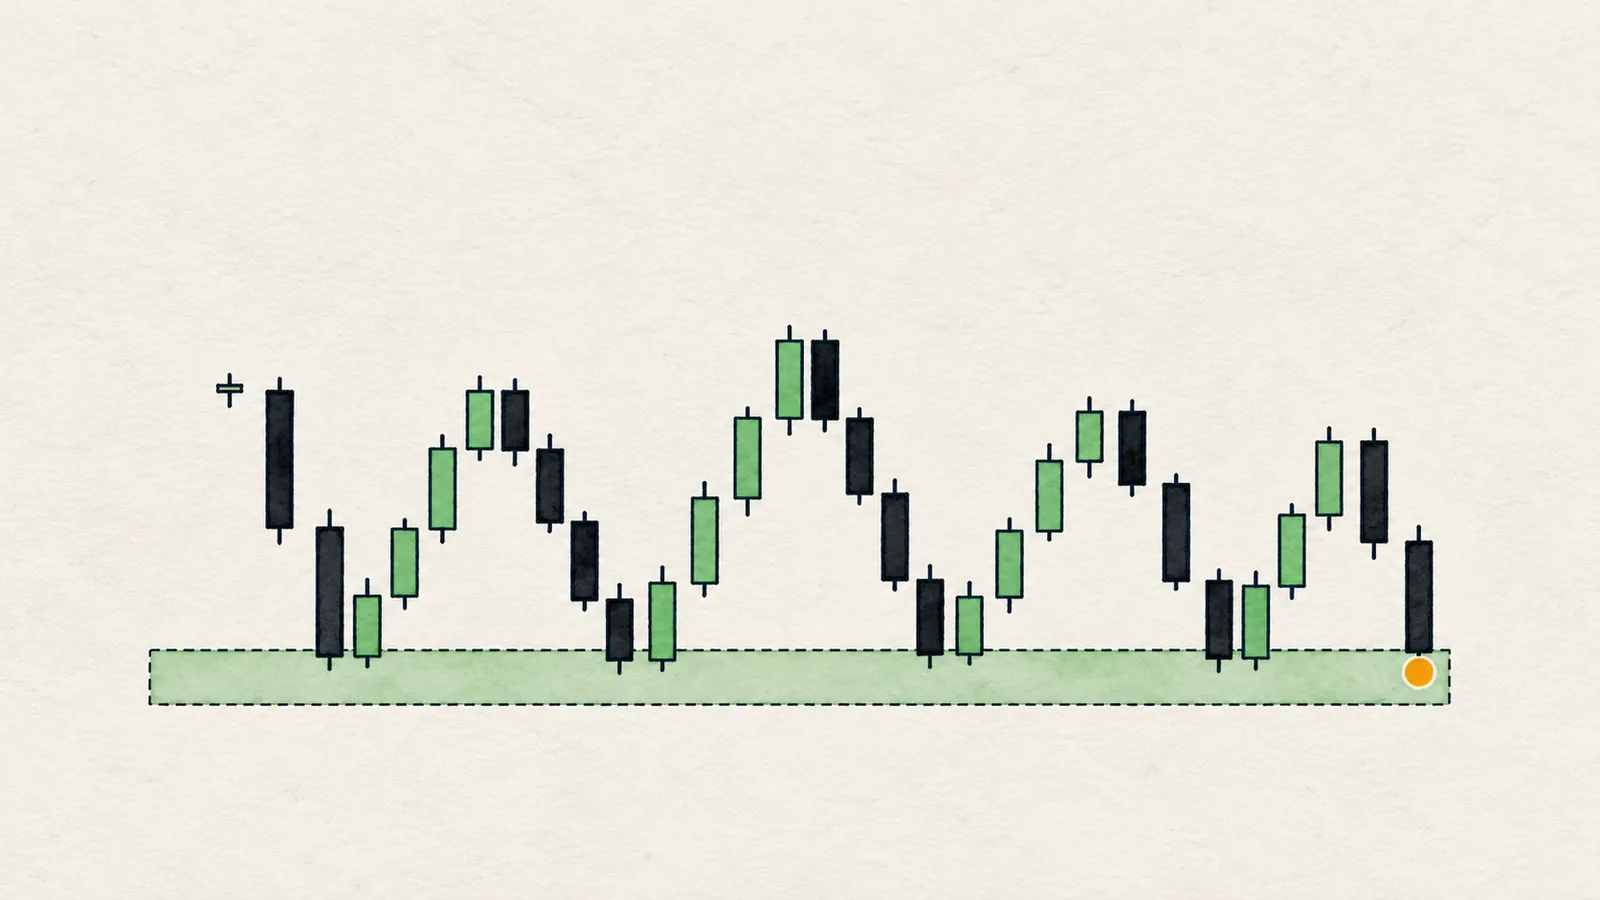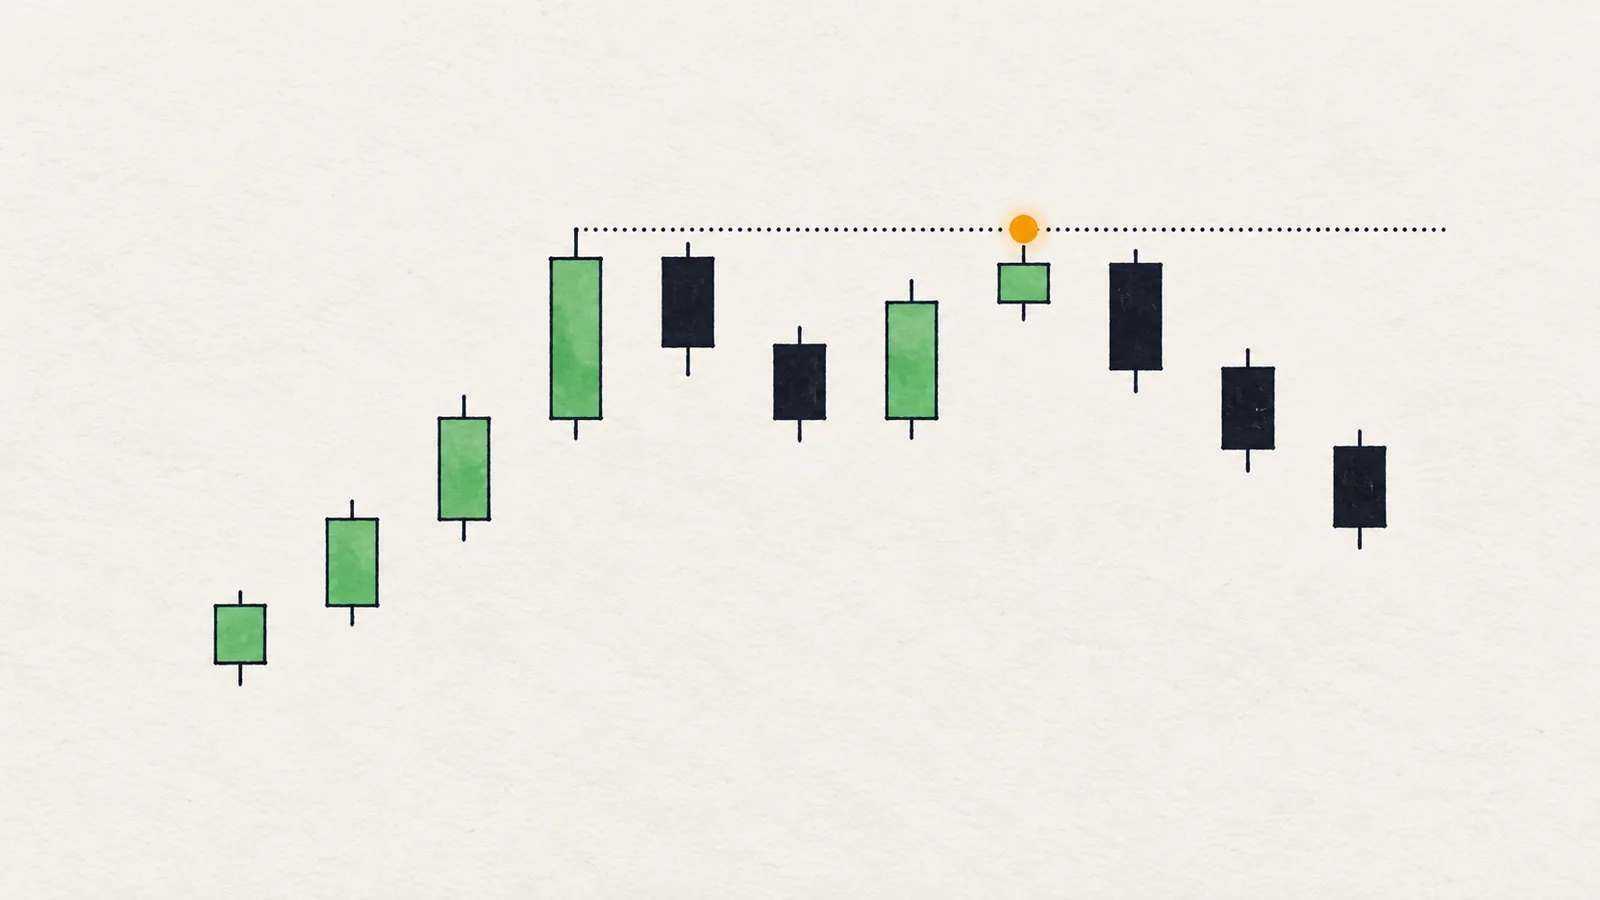
Equal highs and equal lows (EQH and EQL) are two or more swing highs, or two or more swing lows, that sit at almost exactly the same price without price trading beyond them in between. Stop-losses and breakout orders pile up just past them, so the area acts as resting liquidity.
If you have ever drawn a horizontal line through two tops and thought "that is a strong resistance", you have already seen the setup. The question this guide answers is the next one: why does a level that looks so clean so often get run, and what can you do with that knowledge?
What are equal highs and equal lows?
Take a chart and look for swing highs: a candle with lower highs on both sides. If two of those swing highs land at the same price (give or take a very small gap), and price did not trade above them in between, you have equal highs. Flip it for lows.
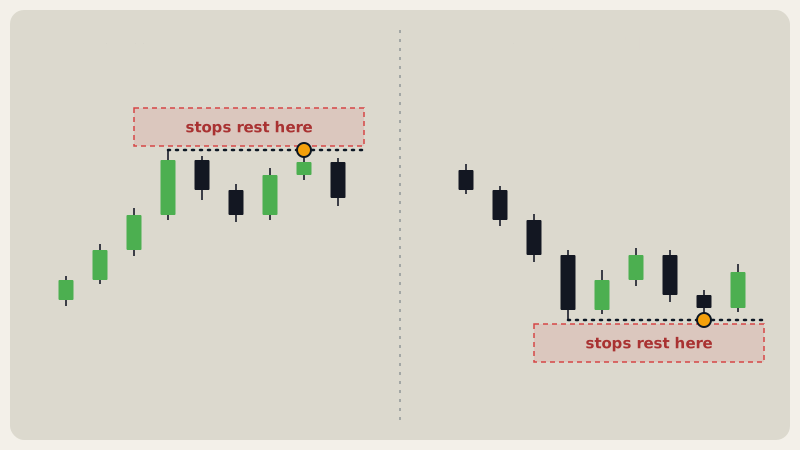
Two things make them special compared with an ordinary swing high:
- They are obvious. Anyone can draw a line through them, so many traders do.
- They are repeated. Price turned at the same price twice, which feels like proof that the level "holds".
Why do equal highs attract price?
Think about who acts at that line:
- Traders who are short because of the "double top" put their stop-losses just above it. A stop on a short is a buy order.
- Traders waiting for a breakout place buy orders above it.
- Traders who bought earlier may place sell orders just under it to take profit.
So above equal highs sits a stack of buy orders, and below equal lows sits a stack of sell orders. For a large participant who needs to fill size, that stack is one of the few places where a lot of counterparties are likely to be waiting. This is the same mechanism described in liquidity sweep: equal highs and lows are the targets, and a sweep is what happens when price reaches them.
The cleaner the line, the more orders. A level that is "too clean" is not stronger support or resistance. It is a bigger target.
How do you spot equal highs and lows?
- Find the swing points. Mark clear highs and lows, not every small bump.
- Compare their prices. Are two of them within a very small distance of each other? Measure the gap against the coin's typical candle size, not against a fixed percentage. A 0.3% gap is tiny on a slow coin and large on a fast one.
- Check the path between them. Price must not have traded beyond that level in between. If it did, the earlier extreme was already swept.
- Check recency. An equal high from months ago, far from current price, is mostly irrelevant. Focus on levels near where price is now.
- Note the timeframe. Equal highs on a 4H or 1D chart gather far more orders than on a 5-minute chart.
What happens when price reaches them?
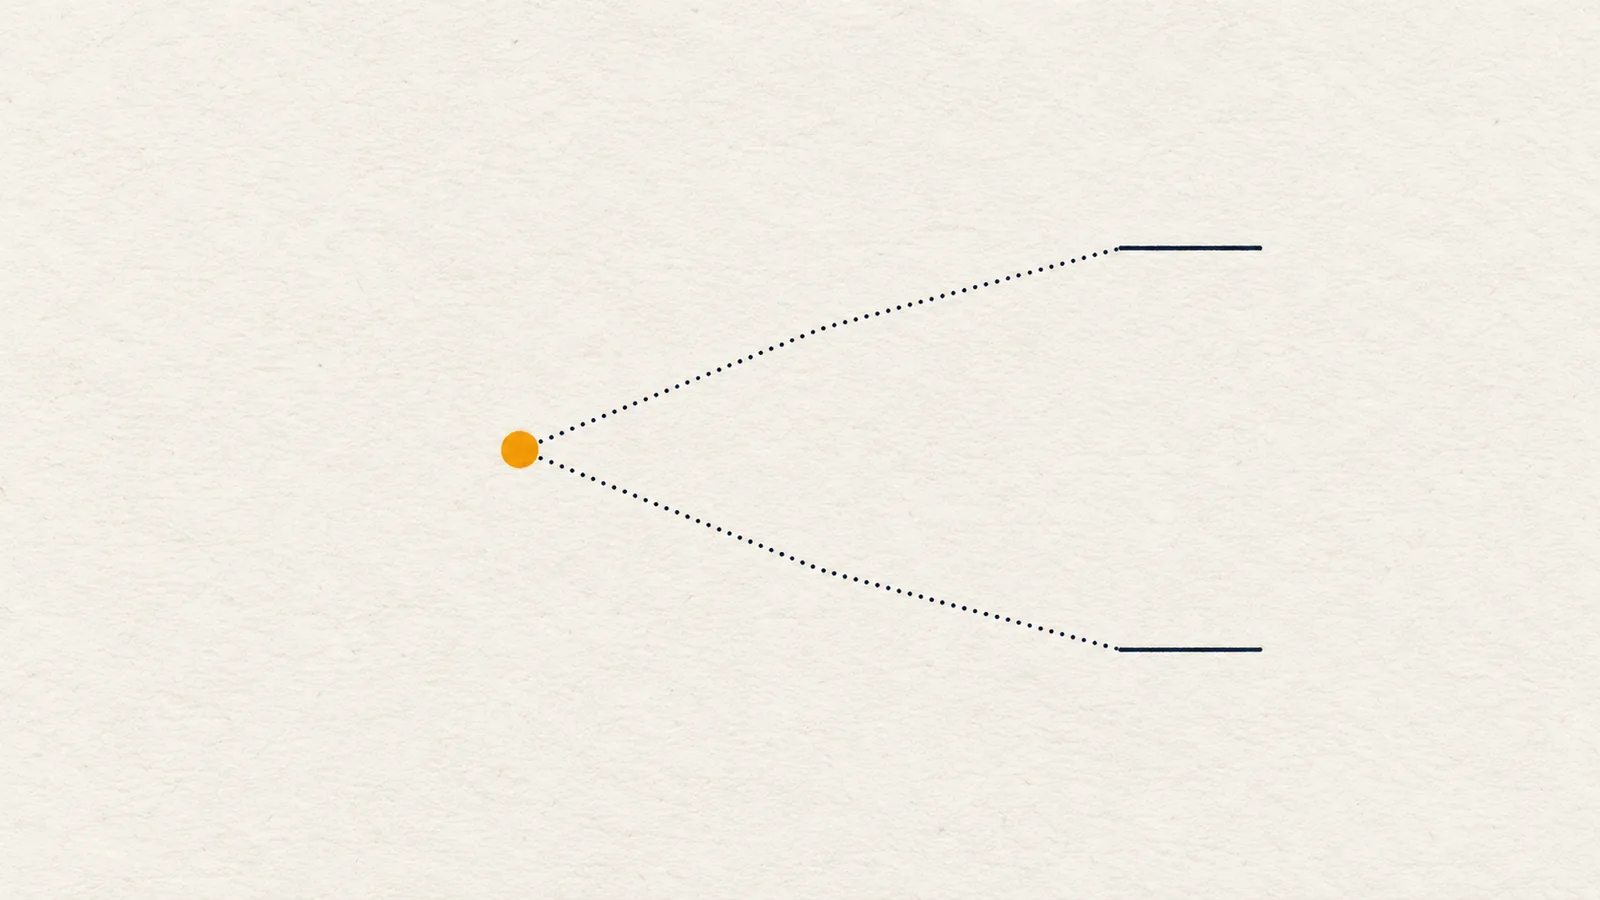
Three typical outcomes, none guaranteed:
- Sweep and rejection. A wick pokes above the equal highs and the candle closes back below. The orders were taken and price had no follow-through. This is a bearish liquidity sweep.
- Clean breakout. The candle body closes above the level and the next candles hold above it. The stop orders fueled the move instead of reversing it.
- Stall. Price sits just under the level for a long time, with no clear result.
Which one occurs depends on the bigger picture: the trend on higher timeframes, volume, and what is happening at other levels. That is why equal highs and lows are used as targets and zones to watch, not as triggers.
Equal highs and lows as targets
In a bullish context, equal highs above price are a natural place for price to travel toward, since there are buy orders to fill against. In a bearish context, equal lows below price play the same role. Useful ways to think about this:
- As a take-profit area. If your idea is a long from lower down, a clean set of equal highs above is a logical place to consider taking some profit, because it is where price may meet a lot of orders and react.
- As a warning for the other side. If you are short under equal highs, those orders above are the fuel for a squeeze against you. Your stop belongs beyond the equal highs by enough distance, or your size should be smaller.
- As a reason to wait. If price is below equal highs with no structure to the downside, a move toward the highs may be the unfinished business. Do not short into it just because the level "looks like resistance".
How to plan around equal highs and lows
Use if/then wording with a close, not a touch:
- If price pushes above the equal highs at 100 but the 4H candle closes back below 100, then I treat it as a sweep and look for a lower timeframe structure shift before any short idea, with the idea wrong above the wick high.
- If a 4H candle closes above 100 and the next one holds, then the highs were broken, not swept, and I look for a retest from above instead.
The numbers are illustrative. For turning this into complete scenarios with invalidation, see trading scenarios and invalidation.
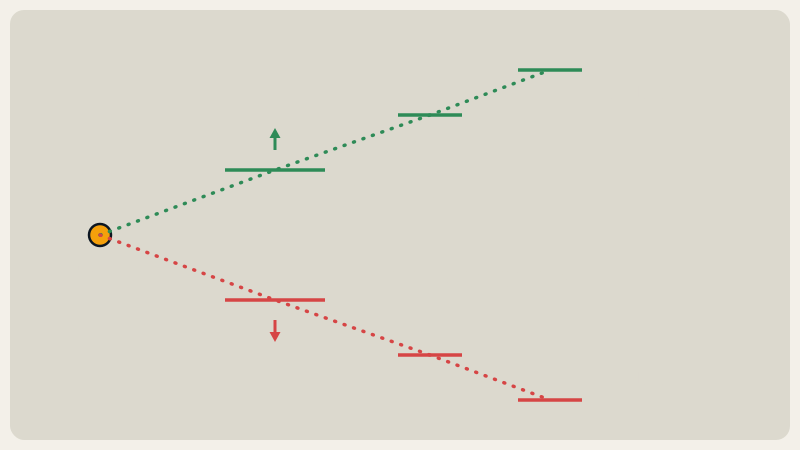
Honest note: Equal highs and lows do not predict reversals, and they are not stronger levels. They are only a map of where orders probably sit. Plenty of equal highs get swept and then price keeps going higher; plenty of "perfect double tops" never get touched again. Treat them as places to watch, with your own confirmation.
Common traps
- Forcing equality. If you must squint and stretch to call two highs equal, they are not equal.
- Using old levels. Equal highs from many weeks back, far from price, rarely matter today.
- Shorting the level blindly. The whole point is that the level may be run. Wait for a close back inside or for structure to shift.
- Mixing timeframes. Two highs that are equal on a 15-minute chart are not meaningful on a 1D chart. Decide which timeframe your plan lives on.
- Forgetting the other side. For every set of equal highs above price there may be equal lows below. Price is not always headed for the nearest one.
In Chart Radars: two swing points count as equal highs or equal lows when they are within 0.15 ATR of each other and price has not traded beyond that level in between. The engine looks over the last 80 candles and keeps only levels within 6 ATR of the current price. In level ranking, equal highs and lows get the top priority for naming a level, and they appear on the chart as EQH and EQL. The engine describes them as stops resting above or below, and uses them as upside or downside targets.
Real examples
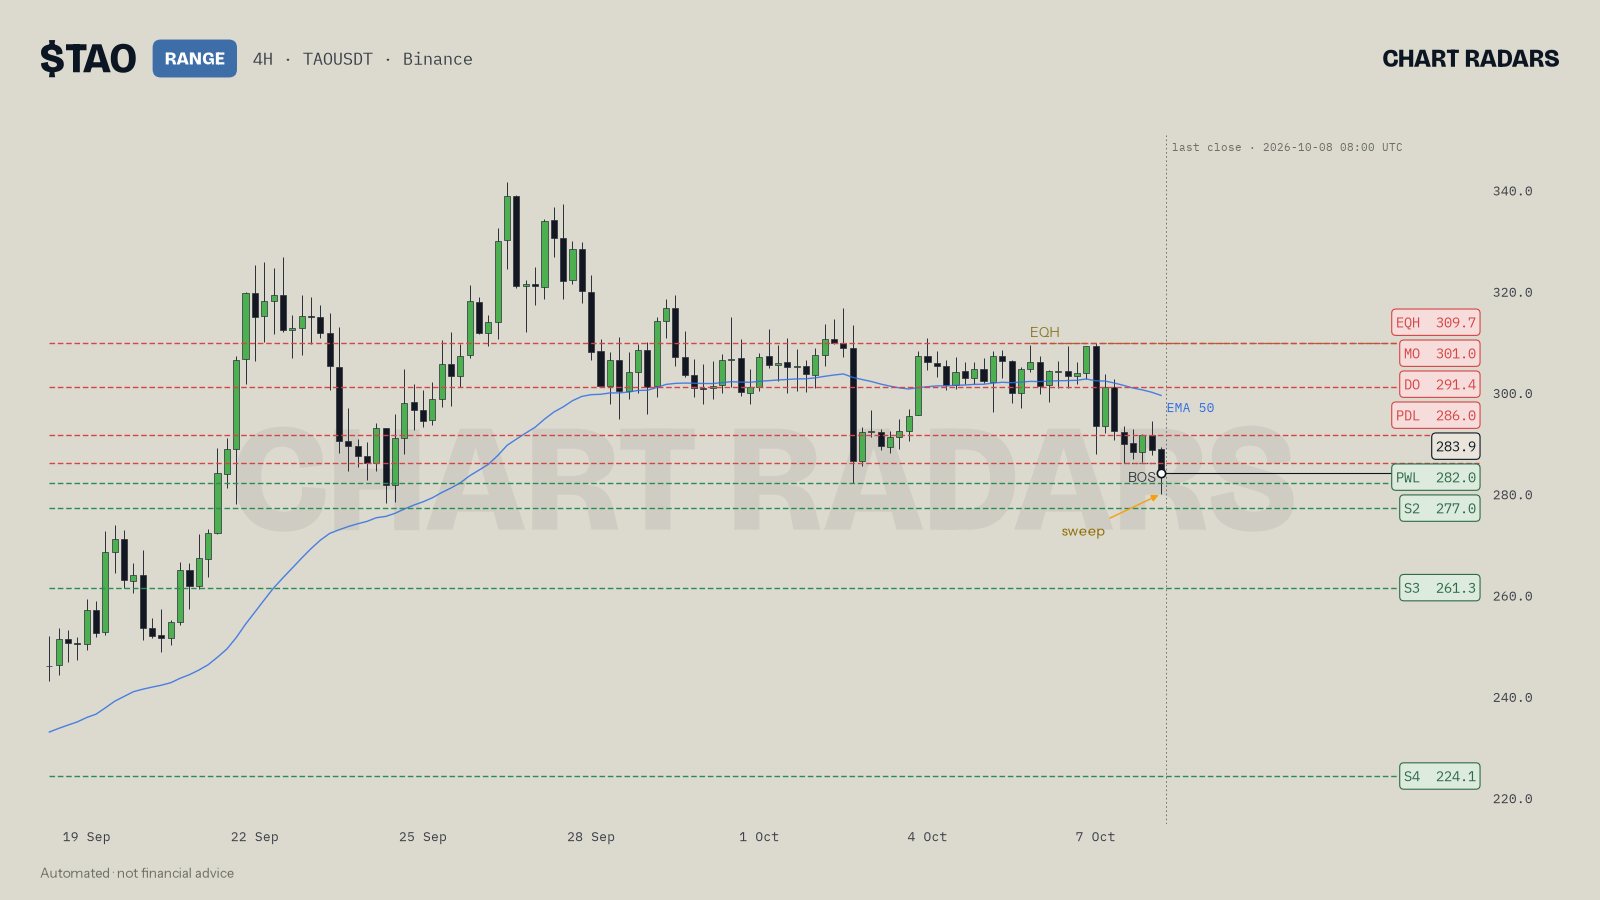
On TAO 4H, 8 Oct 2026 (candle opened at 04:00 UTC), the chart shows an EQH at 309.7 well above the 283.9 close, along with the monthly open at 301.0 and daily open at 291.4 between them. The read was neutral, with price in a range between 282.0 and 286.0. It used the 309.7 equal highs as the final upside target after the 286.0, 291.4 and 301.0 levels, described as "where stops rest". It also listed a bearish RSI divergence as a caution. The same chart carries a sweep mark at the 282.0 prior-week low, a reminder that one chart often has liquidity on both sides.
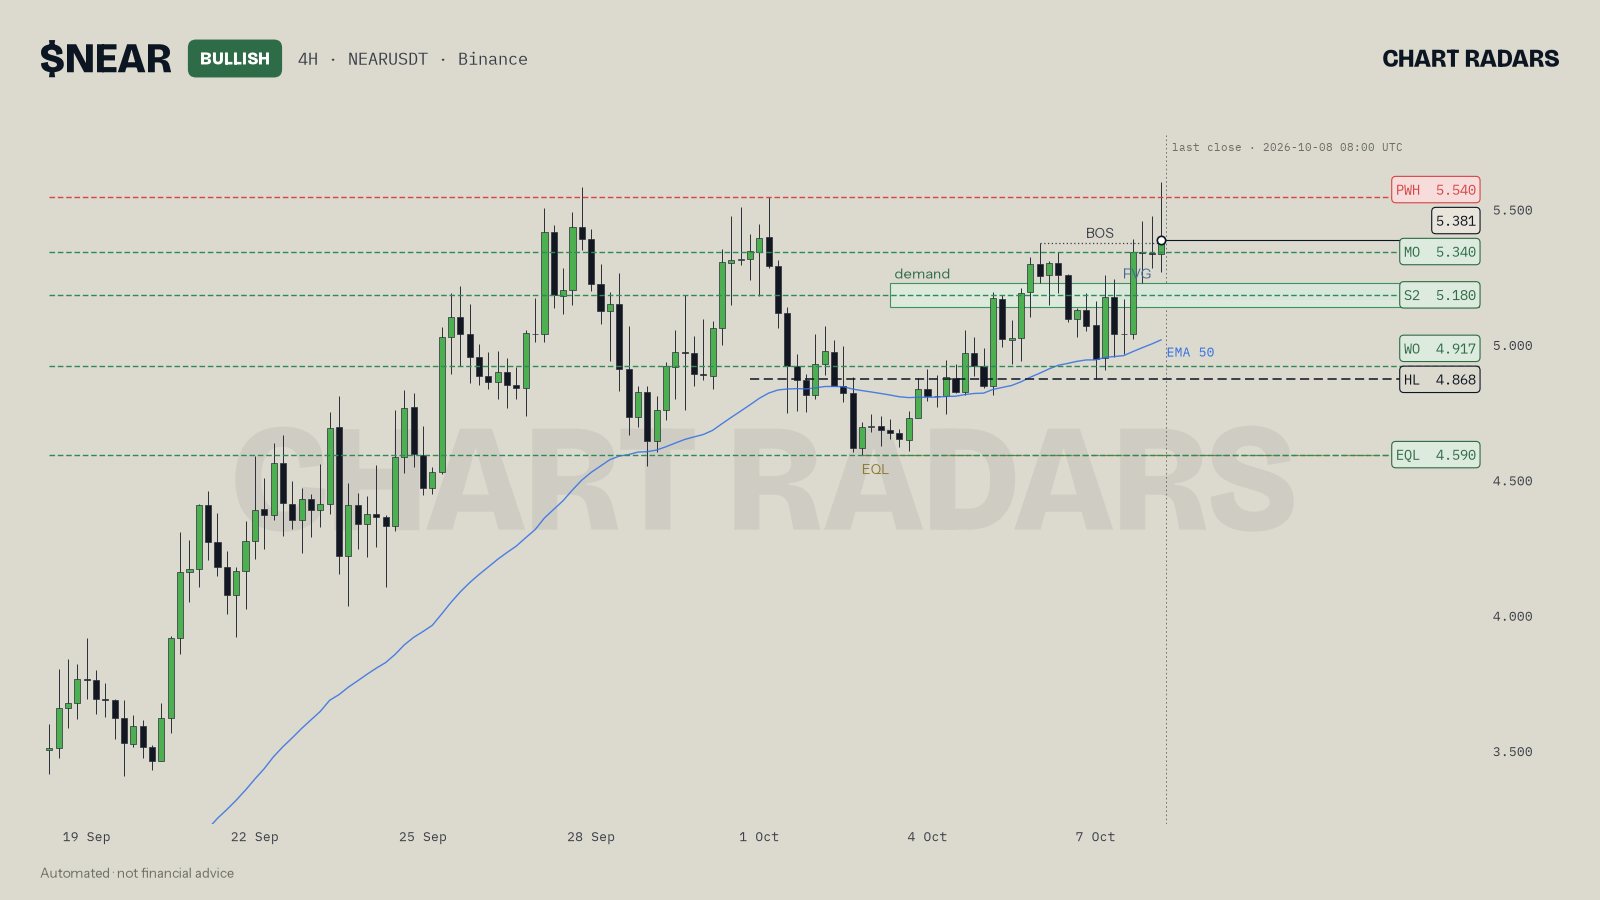
On NEAR 4H, 8 Oct 2026, the chart shows an EQL at 4.59 well below the 5.381 close. The read was bullish, with the protective higher low at 4.868, so the equal lows sat far below that invalidation level. That is a good example of distance mattering: the EQL is real resting liquidity, but with price above 5.00 and the structure intact, it is not part of the near-term plan. It becomes relevant only if the 4.868 higher low fails.
Key takeaways
- Equal highs and equal lows are two or more swing points at nearly the same price, with price not trading beyond them in between.
- Stop-losses and breakout orders stack just beyond them, so they act like targets, not walls.
- A clean double top is not proof of strong resistance. It is a bigger pool of orders.
- Judge the outcome by the close: a wick and a close back inside is a sweep, a held close beyond is a breakout.
- Use them as targets and watch zones inside an if/then plan, with an invalidation, never as a standalone entry.
Frequently asked questions
What are equal highs and equal lows in trading?
Equal highs are two or more swing highs at nearly the same price, and equal lows are two or more swing lows at nearly the same price. Stop orders tend to accumulate just beyond them, which makes them a liquidity target.
Why does price go back to equal highs?
Because a lot of stop-losses and breakout orders sit just above them. That cluster of orders gives a large move something to fill against, so price is often drawn toward the level.
Are equal highs bullish or bearish?
Neither by themselves. They mark where orders rest. What happens when price arrives, a sweep and reversal or a clean breakout, is what carries the bias.
How close do two highs need to be to count as equal?
There is no universal number. A fair approach is to measure the gap in ATR, a coin's typical candle size, so the rule works on any asset. Chart Radars uses 0.15 ATR.
Is a double top the same as equal highs?
They look alike, but a double top is a reversal pattern claim, while equal highs only describe resting liquidity. Equal highs do not tell you that price will reverse.