A candlestick is a way of drawing the price action of one time period, such as one hour or one day. Each candle records four prices: the open, the high, the low and the close. The thick part, the body, spans from open to close. The thin lines, the wicks, reach to the high and the low.
That is the whole format, and it is enough to read a surprising amount from a chart. This guide explains what each part tells you, why traders care so much about the close, how to read wicks as rejection, and which common patterns are worth knowing. It also says plainly where candle patterns are oversold.
What does a candlestick show?
Take a 4H candle. At its start, price opened at some level. During the next four hours it traded higher and lower. At the end, it closed. Those four numbers (open, high, low, close, or OHLC) are everything the candle keeps.
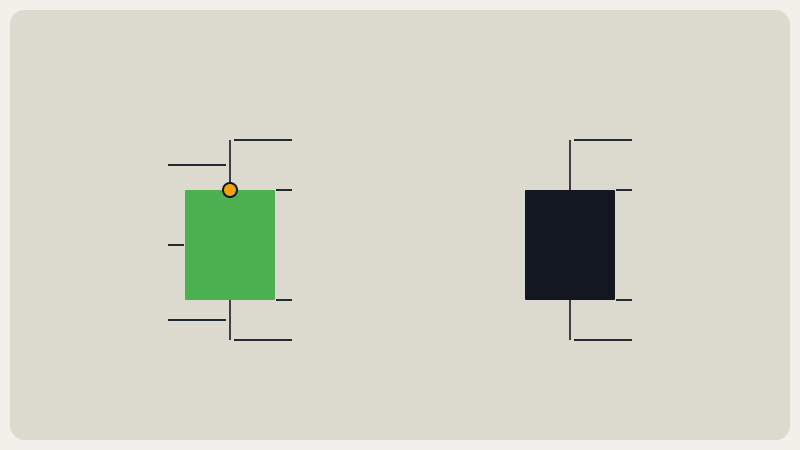
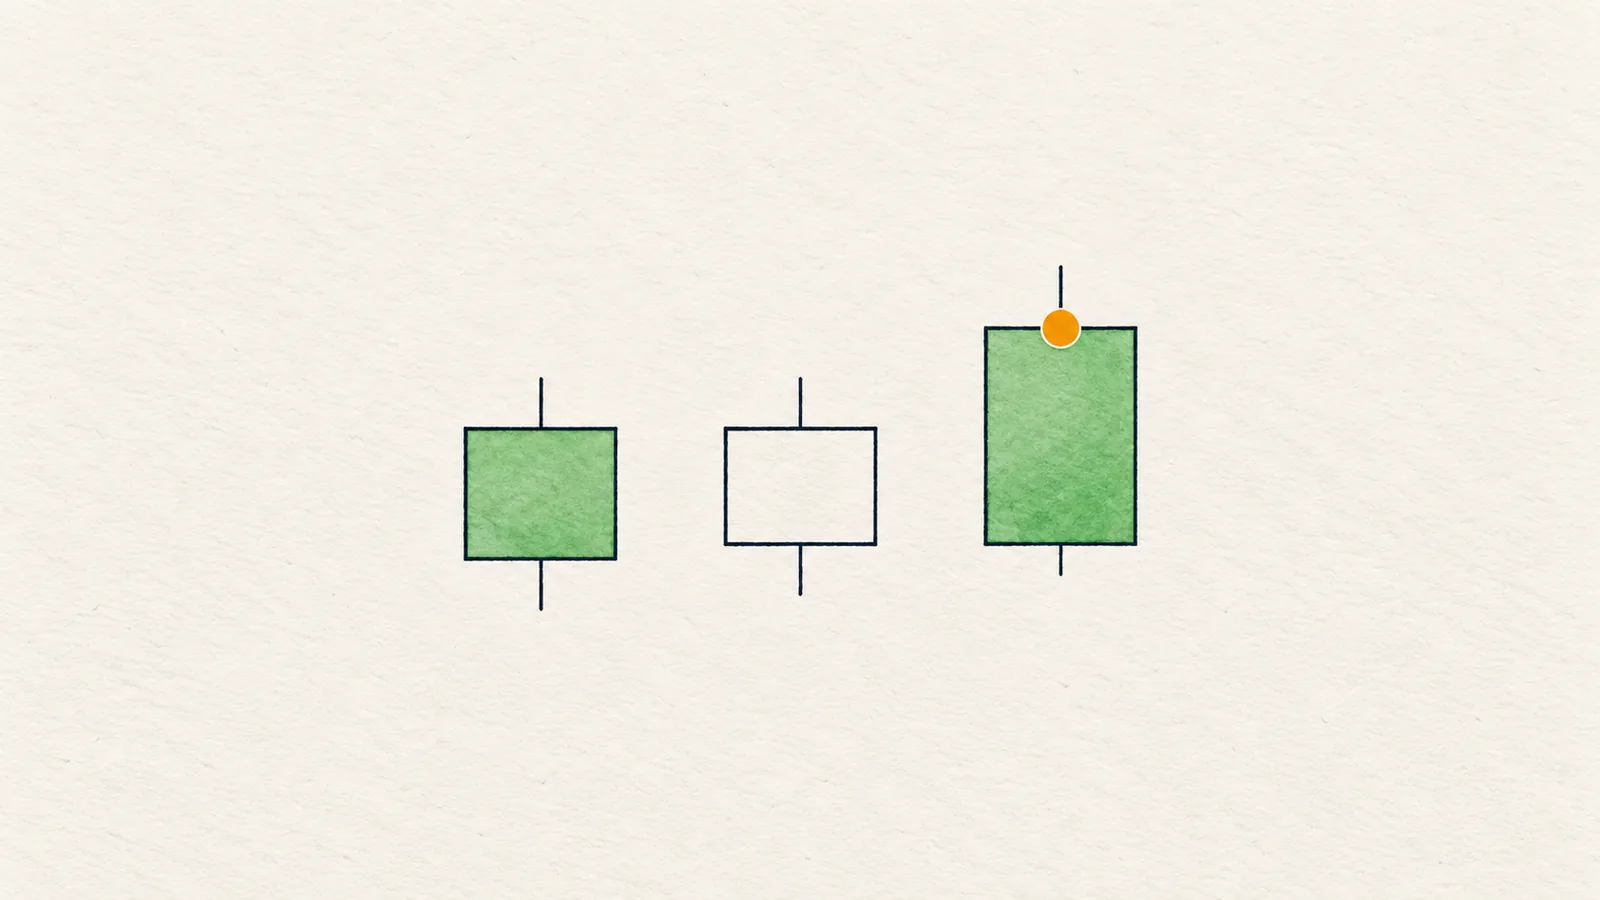
- Body: the range between open and close. A big body means price moved decisively in one direction over the period.
- Upper wick: from the top of the body to the high. Price went up there and came back.
- Lower wick: from the bottom of the body to the low. Price went down there and came back.
- Color: on most platforms green (or hollow) means the close was above the open, red or black means it was below. On Chart Radars charts, up candles are green and down candles are black.
Color alone says only whether the period ended higher or lower than it began. The shape says how it got there.
How do you read the body and the wicks?
Read a candle as a short negotiation. The body shows who won the period. The wicks show attempts that failed.
- Large body, small wicks. One side controlled the period from start to finish. Little was rejected.
- Small body, long wicks on both sides. Price went both ways and came back near where it started. Neither side won. This is indecision, and it is common in a range.
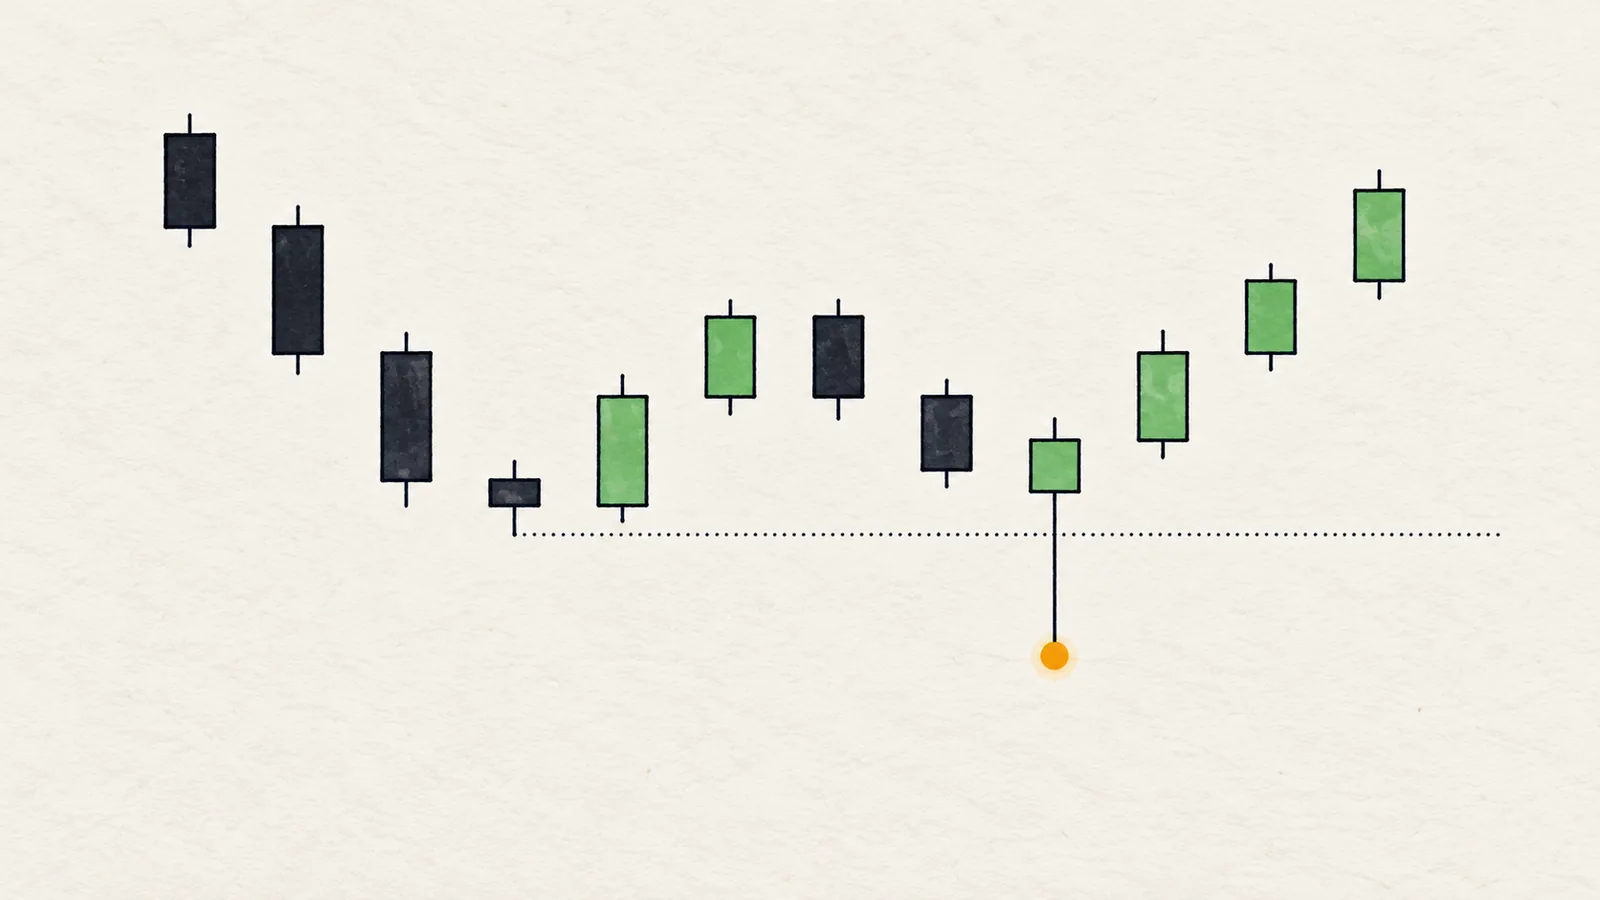
- Long upper wick, close near the low. Buyers pushed price up, sellers took it all the way back. The high was rejected.
- Long lower wick, close near the high. Sellers pushed price down, buyers took it back. The low was rejected.
A useful habit is to ask one question of every candle: where did it close inside its own range? A close near the top says buyers had the last word. A close near the bottom says sellers did. A close in the middle says the period was a draw.
Why does the close matter more than the high or the low?
The high and the low of a candle can be set by a few seconds of thin trading, a liquidation cascade or one large order. The close is different. It is the price that stood when the period ended, after every participant had the chance to react. Think of it as the market's accepted price for that period.
This is why serious chart reading is built on closes:
- A level has broken when a candle closes beyond it, not when a wick touches it.
- A sweep is a wick beyond a level with a close back inside. The close decides which of the two you are looking at. See liquidity sweep.
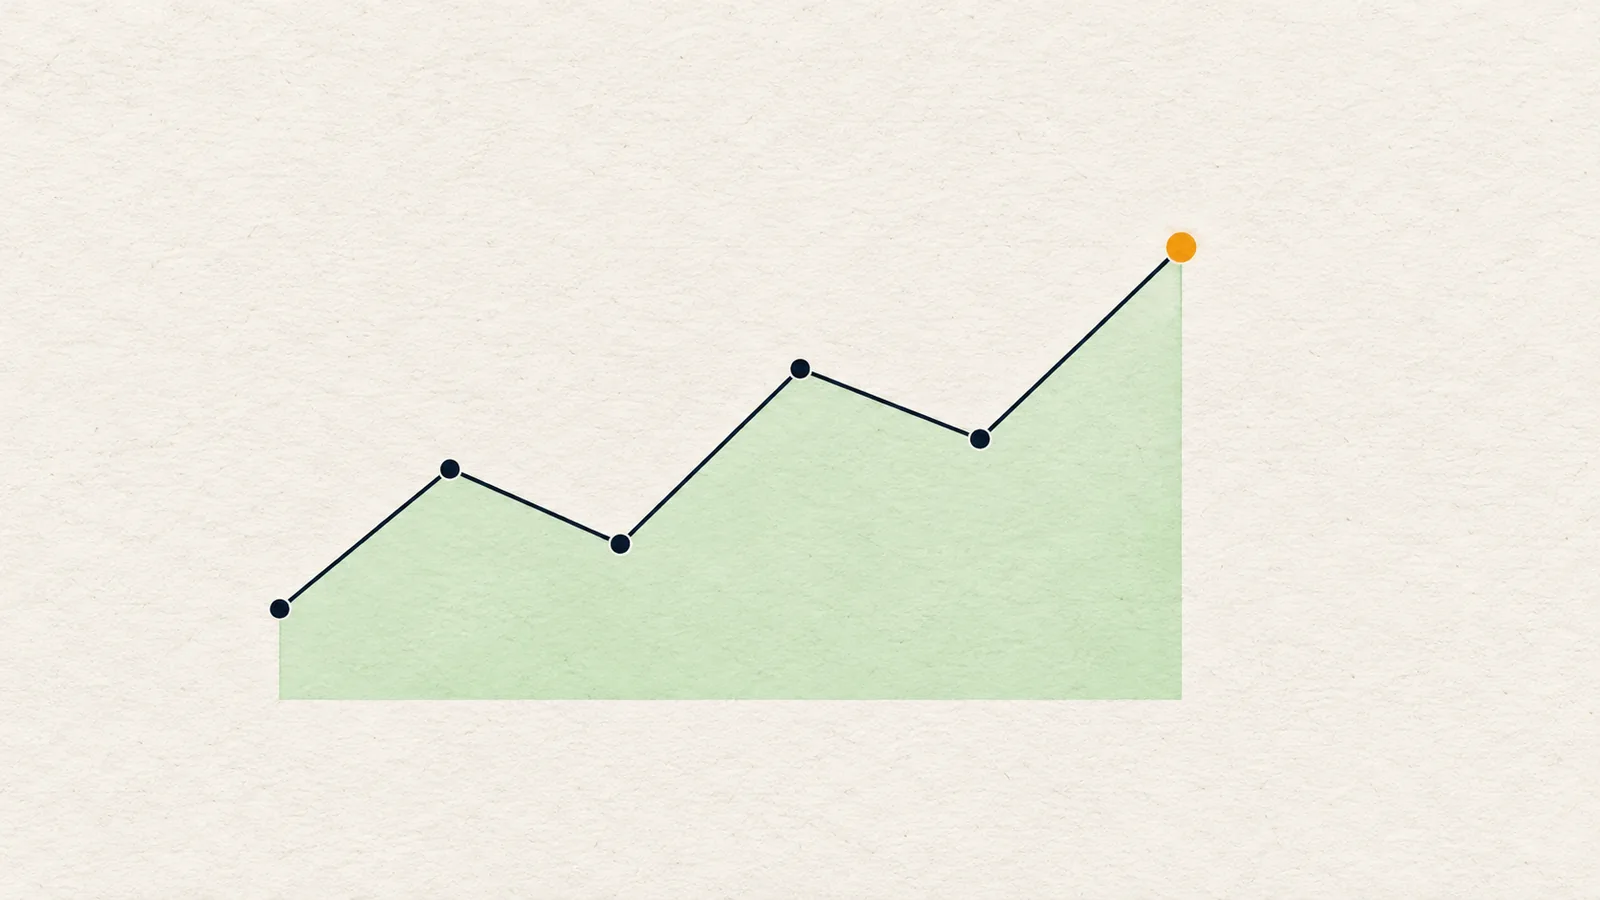
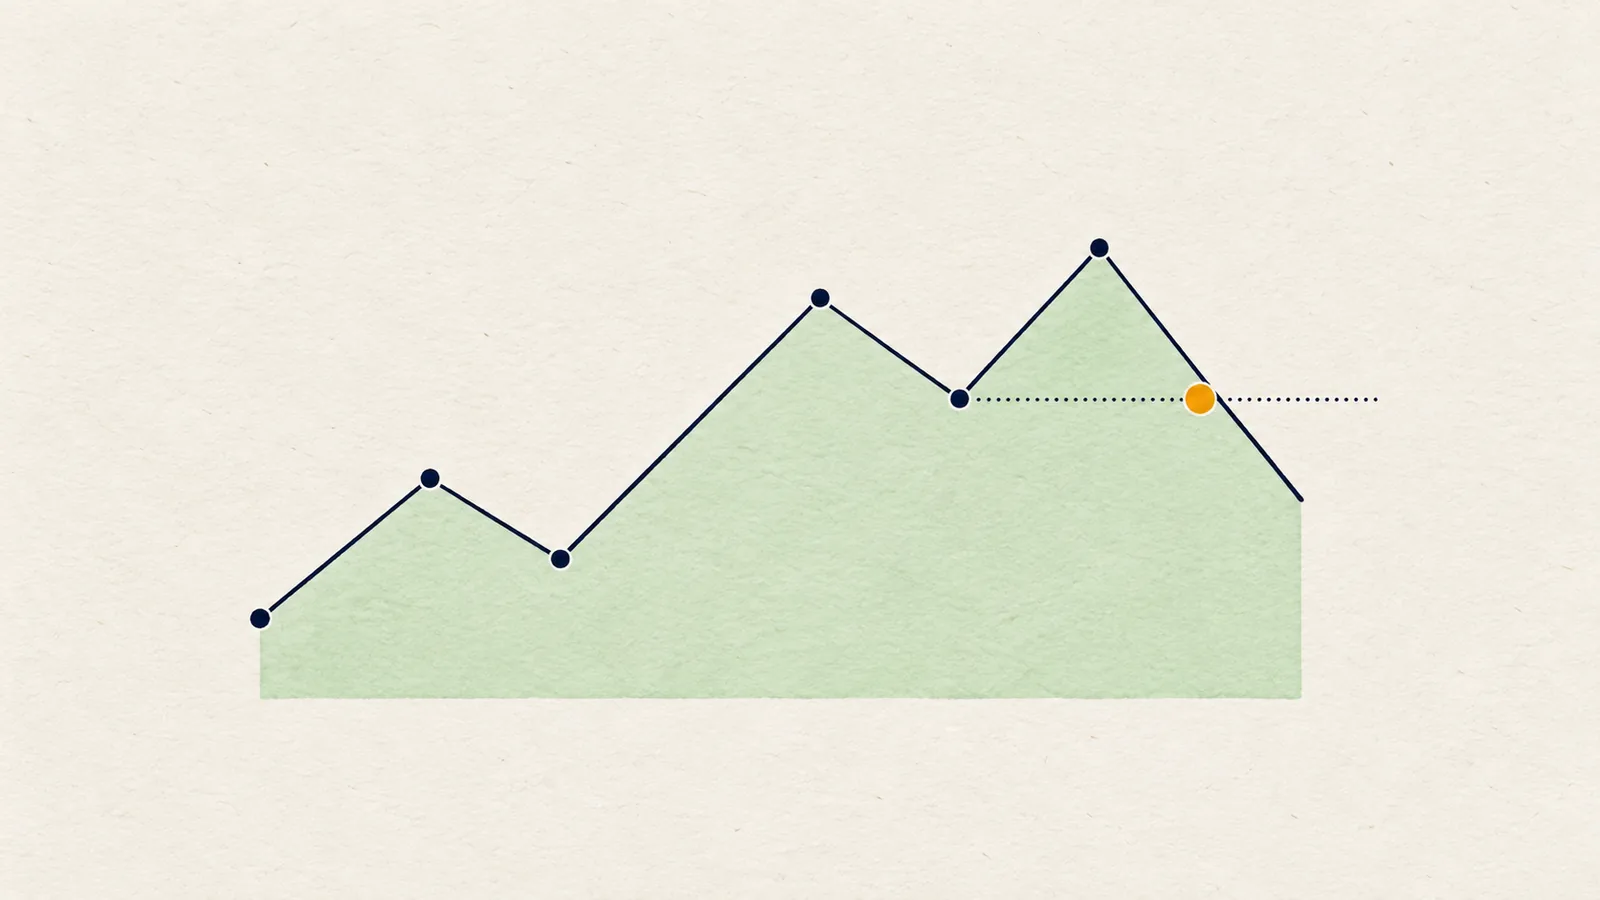
- A break of structure needs a close beyond the swing point. See BOS vs CHoCH.
The same rule protects you from acting on a candle that has not finished. A 4H candle that is still forming can look like a breakout at minute 200 and close back inside by minute 240. Wait for the close.
What do wicks tell you about rejection?
A wick is the part of a move that the market refused to keep. Price traded there, found enough orders on the other side, and left. Several things make a wick more meaningful:
- It sits at a level. A long wick through a swing high or a prior-day high says more than a long wick in empty space.
- It is long compared with recent candles. Compare it with the typical candle size, which is what ATR measures. A wick of one normal candle is routine; a wick of two or three is notable.
- The next candle respects it. If the following candle closes beyond the wick's tip, the rejection failed.
A wick is information about the past candle only. It is not a prediction that price will leave that level.
Which candlestick patterns are worth knowing?
There are dozens of named patterns. Most are variations on the four shapes above. A short list is enough:
- Doji: open and close almost equal, wicks on one or both sides. Indecision.
- Hammer and shooting star (pin bars): small body at one end, a long wick on the other. Rejection of a low (hammer) or a high (shooting star).
- Engulfing candle: a body that fully covers the previous candle's body, in the opposite color. One side took control back within a single period.
- Inside bar: a candle fully within the previous candle's range. Compression, often before a larger move in some direction.
Each of these is a description, not a forecast. A hammer in the middle of a range is noise. A hammer at a level you marked in advance, with a higher timeframe pointing the same way, is a reason to look closer.
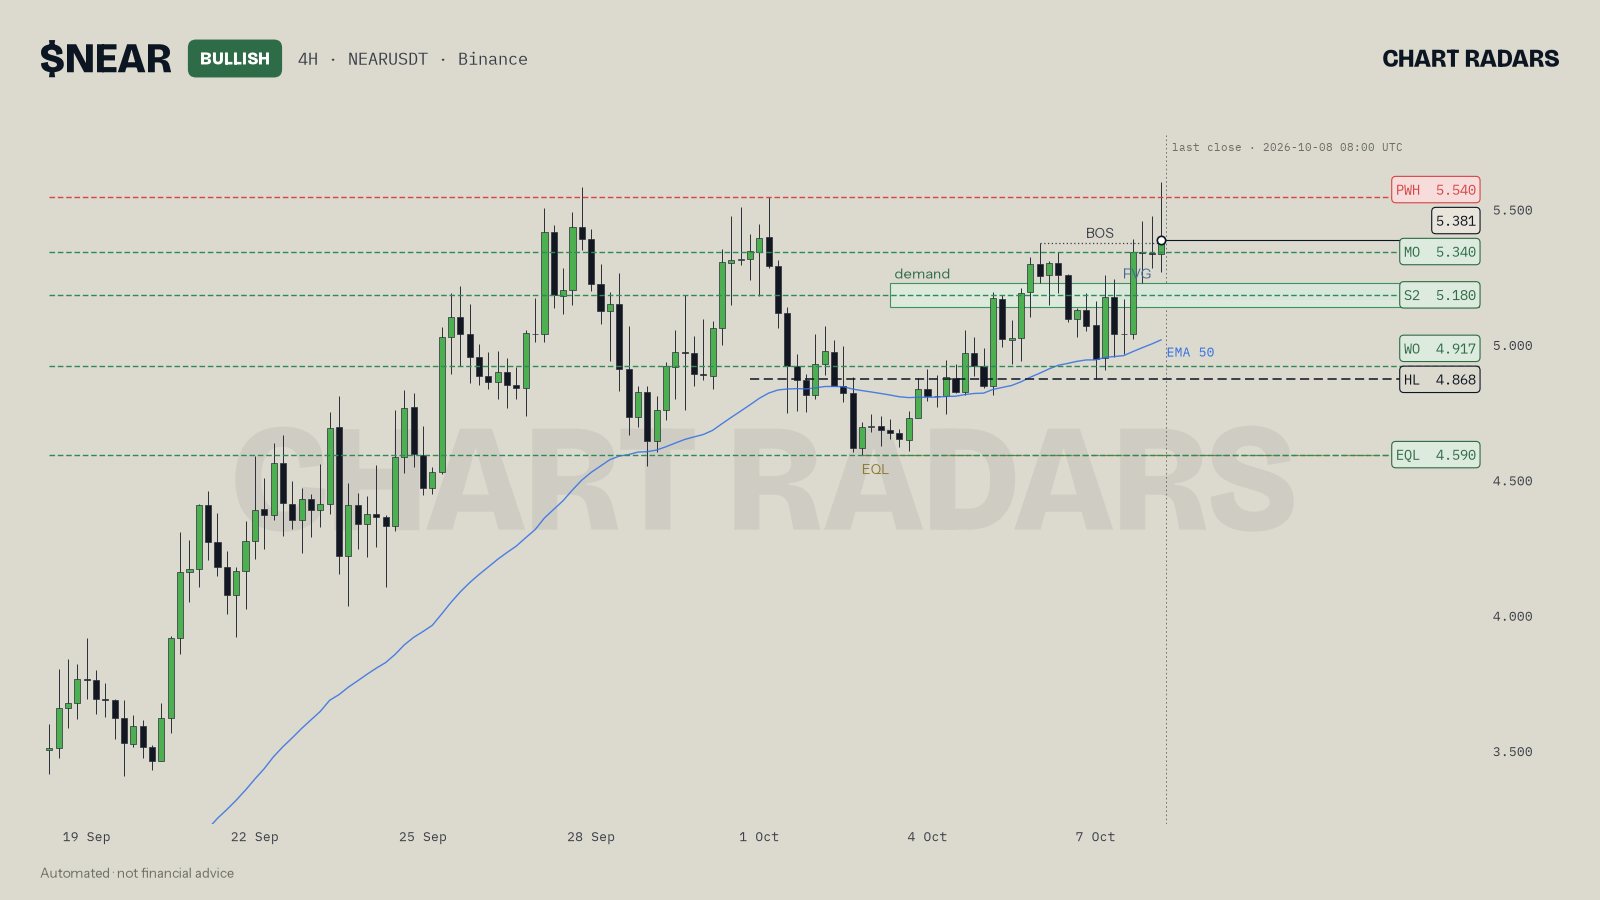
On NEAR 4H, close of 8 Oct 2026, the last candle is a good exercise. Its upper wick reaches above the 5.540 line (the prior-week high) but its close, 5.381, sits well below that line. A wick through a level and a close under it is a rejection of that price, for now. The read treats 5.540 as the level still to beat on a 4H close, and notes that the last candle traded at 2.3 times the average volume.
Honest note: Candlestick patterns are more famous than useful. A pattern that looks perfect after the fact appears all the time without anything following it, and the same shape can mean opposite things in different places. Use candles to read the story at levels you already trust, and never as an entry by themselves.
How do candles fit into a plan?
Candles are the evidence layer. Levels, structure and higher timeframe context tell you where to look; candles tell you whether the market is accepting or rejecting that price.
- If price reaches a level I marked and the candle closes back from it with a long wick, then I note a rejection and look for a confirmation such as a structure shift on a lower timeframe.
- If instead the candle closes beyond the level with a full body, then the level broke and the idea of a rejection is off.
Both branches use the close. See market structure for how the swings those levels come from are defined.
Common mistakes with candles
- Reading unfinished candles. What you see mid-candle is not yet a candle.
- Ignoring size. A small body on a quiet day is not the same as a small body after a violent one. Judge size relative to recent candles.
- Treating a pattern as an order. Names like "bullish engulfing" sound like instructions. They are descriptions.
- Reading one candle in isolation. A candle means little without the few before it and the level it is at.
- Mixing timeframes. A 5-minute hammer under a daily resistance is a different event from a daily hammer.
In Chart Radars: the engine uses closed candles only. A swing point is a candle whose high (or low) beats the 3 candles on each side, so it is confirmed 3 candles late. A sweep is flagged when a wick within the last 3 candles goes past a swing point from the last 40 candles and the candle closes back inside. A body close beyond the swing point counts as a break instead, and a structure break always needs a close. Sizes are compared in ATR, not in raw price.
Key takeaways
- Each candle stores four prices (open, high, low, close). The body spans open to close and the wicks reach the extremes.
- Ask where the candle closed inside its own range: near the top, near the bottom or in the middle.
- The close is the accepted price, so breaks and sweeps are judged on closes, not on wicks.
- A wick is rejection of a price. It matters at a level and when it is long relative to recent candles.
- Patterns describe behavior. They do not predict, and they are weakest in the middle of a range.
Frequently asked questions
How do you read a candlestick chart for beginners?
Look at four prices per candle: open, high, low and close. The thick body spans open to close, the thin wicks reach to the high and the low. Green or hollow usually means the close was above the open; red or black means below. Then ask where the candle closed inside its own range.
What does a long wick on a candle mean?
Price traveled there but could not stay. A long upper wick means buyers pushed up and were pushed back; a long lower wick means sellers pushed down and were pushed back. It is rejection of a price, and it matters most at a level you already marked.
Why does the closing price matter more than the high or low?
The close is the price the market accepted when the period ended. Highs and lows can be brief spikes, but a close is where orders settled. That is why breaks of structure and sweeps are judged on closes.
Are candlestick patterns like hammer and engulfing reliable?
Not on their own. Patterns describe one or two candles of behavior. They are more informative at a clear level and with higher timeframe context, and nearly meaningless in the middle of a range.
Should I trade a candle before it closes?
A forming candle can look like a breakout or a rejection and then flip by the close. Judging candles only after they close removes most of that false reading, at the cost of acting a little later.