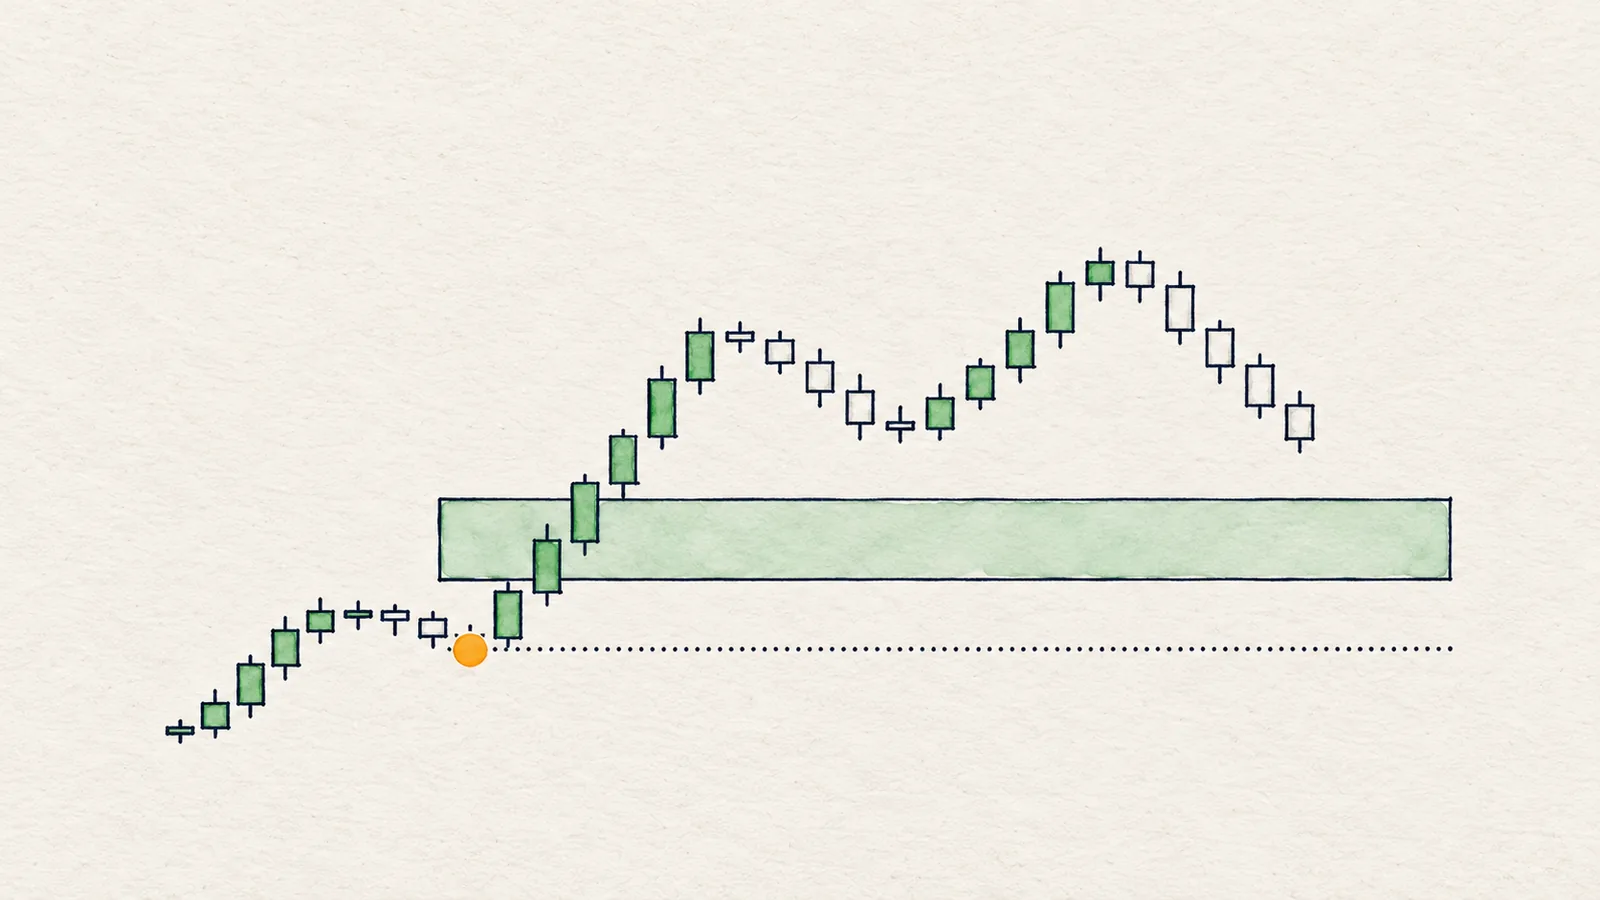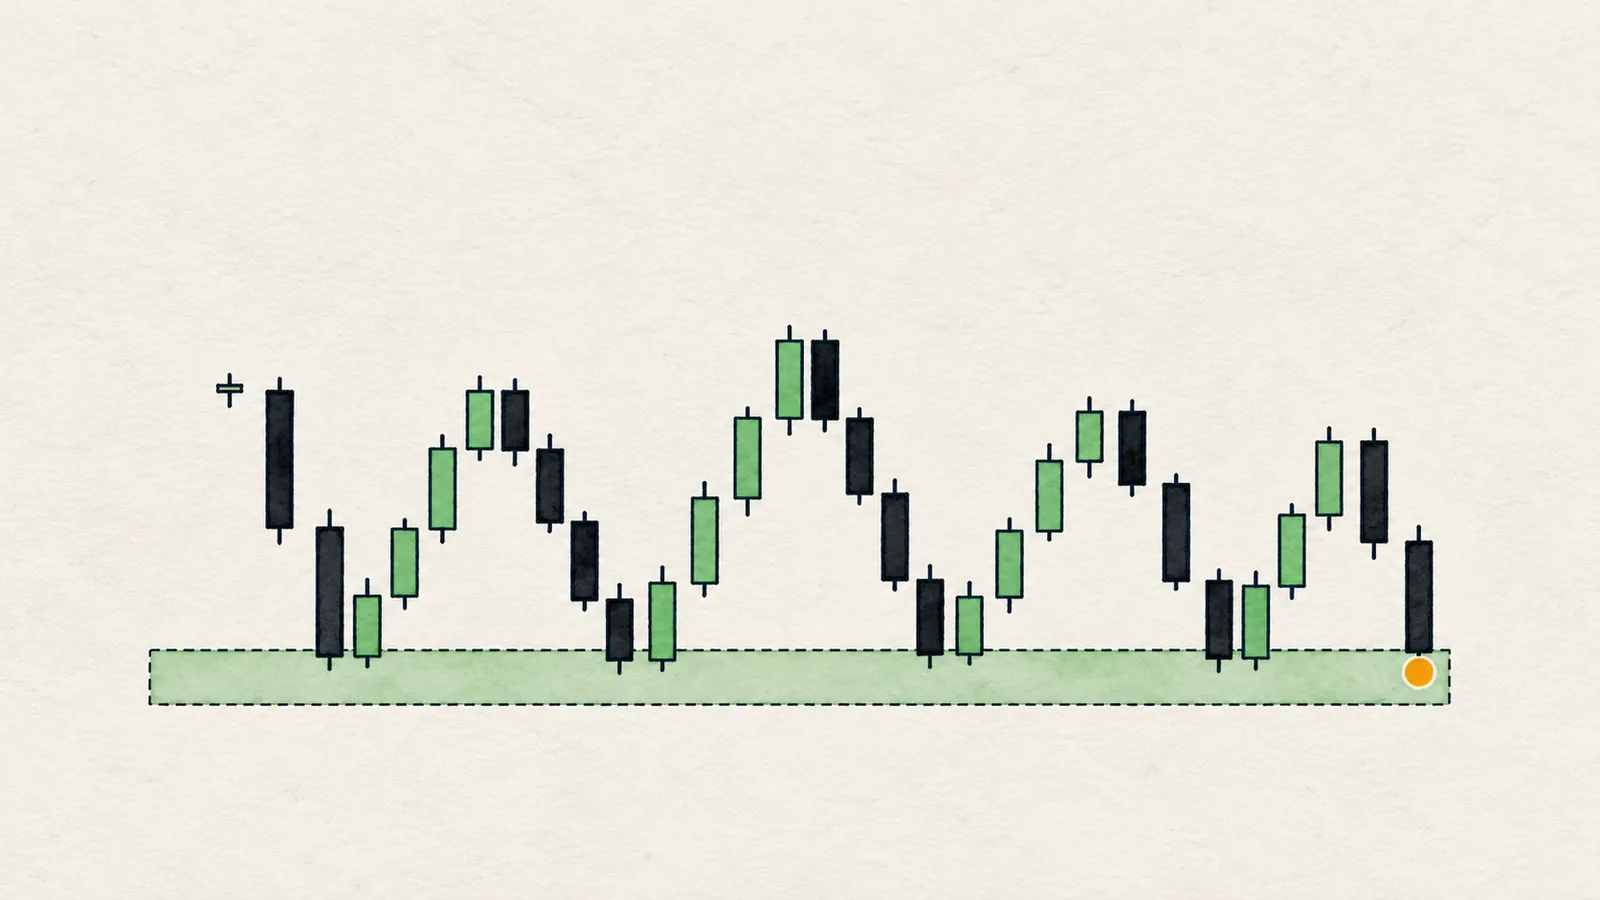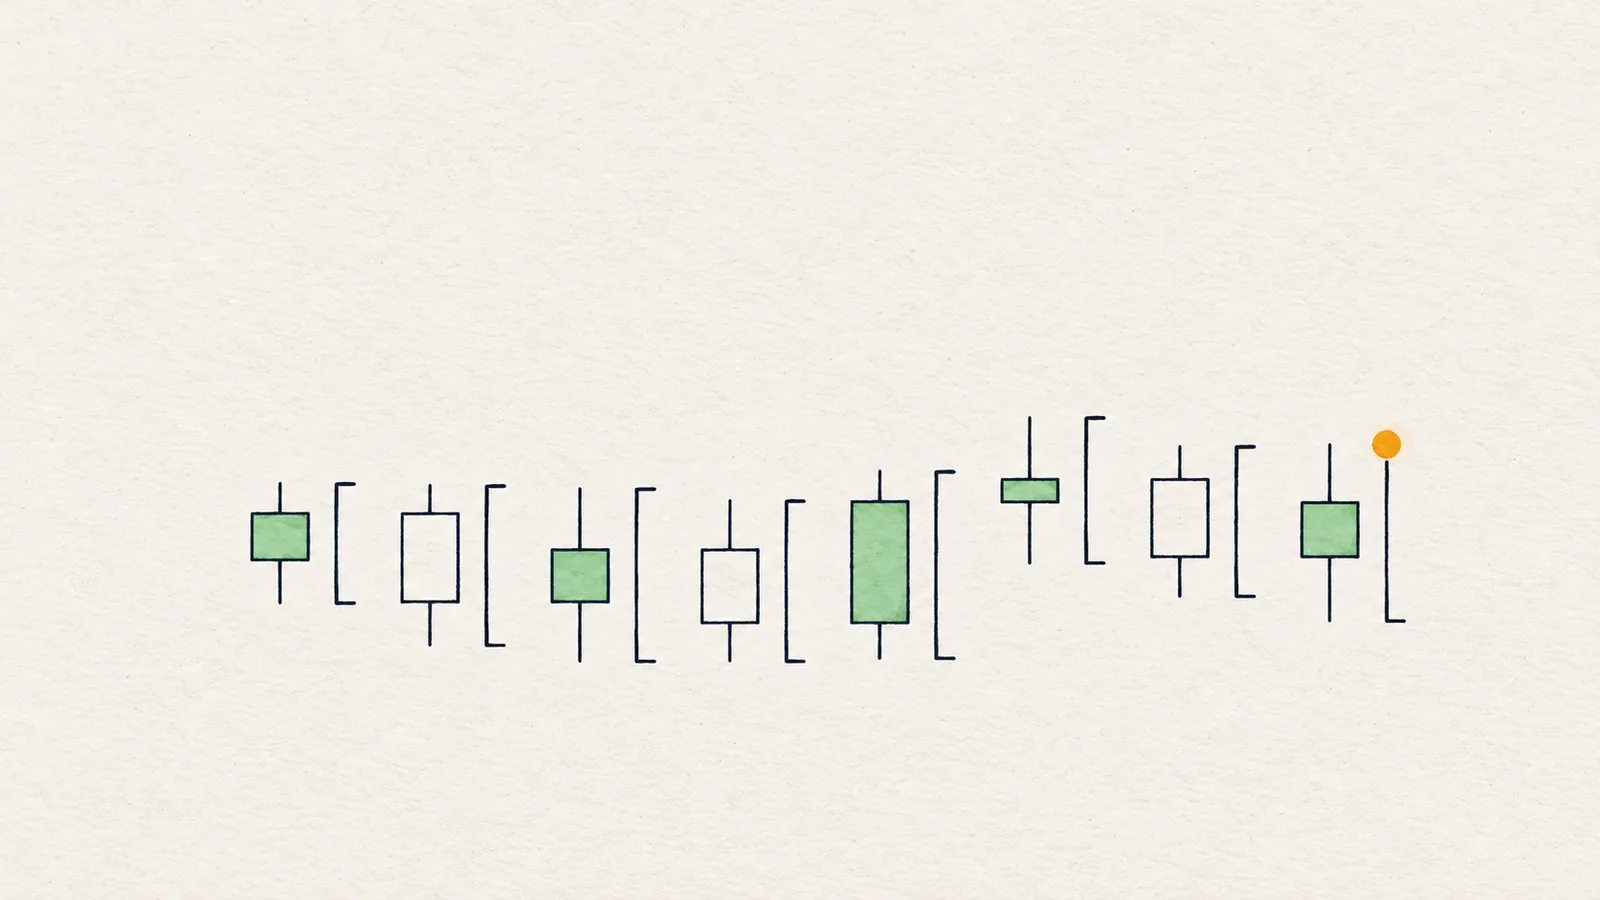
ATR, short for average true range, is an indicator that measures how much price typically moves in one candle. It averages the size of the most recent candles (14 by default), counting gaps between candles too. It has no direction. It answers one question: how big is a normal candle right now?
That one number solves a problem every chart reader runs into. Is a 2% move large? On Bitcoin on a quiet weekend, yes. On a small altcoin on a normal day, no. This guide explains how ATR is calculated in plain words, why measuring distances in ATR makes rules work across coins, and how to use it for tolerance, stop distance and a quick sense of whether a move is big.
What is ATR in simple terms?
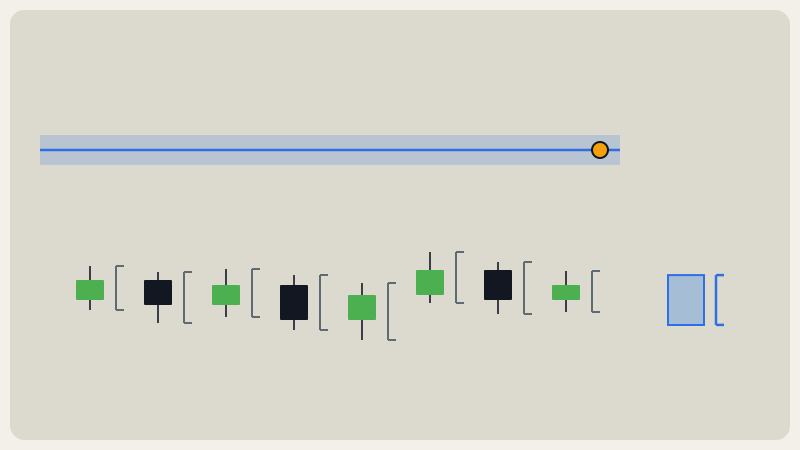
Imagine you want to know how far a typical candle travels. The simplest answer is high minus low for each candle, averaged. ATR does that with one improvement: it also counts the gap between yesterday's close and today's range, because price can jump over a distance without trading in it.
So ATR is the typical candle size, expressed in price units. If ATR on a 4H chart is 2.0 and price is 100, a normal 4H candle spans around 2 points. A move of 6 points is three typical candles.
How is ATR calculated?
Two steps:
- True range of each candle. Take the largest of three numbers: the candle's high minus its low; the high minus the previous close (as an absolute value); the low minus the previous close (also absolute). The last two only matter when price gaps.
- Smooth the last 14. The first ATR is the plain average of 14 true ranges. After that each new value is the previous ATR times 13, plus the new true range, all divided by 14. This is Wilder smoothing: it changes gradually, so one wild candle moves the line but does not dominate it.
You never need to do this by hand. What matters is what the result means: a smoothed picture of recent candle size.
Why do traders measure distance in ATR?
Because raw numbers do not travel between assets or between moods of the same asset.
- A 100-point move means something different on a coin at 80000 than on one at 0.5.
- A 1% move is large when the market is asleep and trivial in a volatile week.
- A level that was "far" last month can be "close" today if candles doubled in size.
Measuring in ATR fixes all three. "Price is 1.5 ATR from the level" means the same thing on every coin and in every regime: about one and a half typical candles away. A rule written in ATR (a level is close if it is within 0.3 ATR) adapts by itself: the distance in price grows when candles grow and shrinks when they shrink.
The alternative, fixed percentages, forces you to retune your rules for every coin and every volatility change. It is the main reason ATR-based rules are easier to keep honest.
How do you use ATR for tolerance?
Tolerance is how close counts as "at the level". Prices are rarely exact, so you need a rule for it:
- Two swing highs within a small fraction of an ATR of each other can be treated as the same level, because the difference is smaller than a normal wobble.
- A candle that closes within a small fraction of an ATR beyond a level is a weaker break than one that closes a full ATR beyond it.
- A level "tested" means price came within a set ATR distance of it.
The point is consistency. If your rule says "within 0.3 ATR", you apply the same yardstick to every level and every coin, instead of eyeballing it differently each time.
How do you use ATR for stop distance?
A stop should go where the idea is wrong, which is a structural question: beyond the swing the idea depends on. ATR then tells you whether that place is workable.
- Too close. If the stop is well under one ATR from your entry, an ordinary candle can reach it without any real change in structure. You get stopped by noise.
- Reasonable. A stop one to a few ATR away gives the idea room to be normal.
- Too far. If the nearest structural invalidation is many ATR away, you either size the position much smaller or you accept that the idea does not fit a small risk.
ATR does not choose the stop. It checks it. Keep the level where the structure says, then measure. More on that in where to place invalidation.
How do you tell if a move is big?
Compare the candle (or the whole move) with ATR:
- A candle two or more times its ATR is unusually large for the recent past.
- A pullback of half an ATR after a strong push is shallow; of three ATR it is deep.
- A range that is only one or two ATR tall leaves little room to trade inside it; one five ATR tall does.
This turns "that looks big" into a measurement, and it works the same on a 1H chart as on a 1D chart because ATR is computed from that chart's own candles. It is also a natural companion to candlestick reading, where size matters as much as shape.
Where does ATR mislead?
- It lags. It is an average of the past, so after a sudden volatility burst it is still catching up.
- Gaps and spikes inflate it. One extreme candle raises ATR for days. Smoothing softens this but does not remove it.
- It has no direction. A rising ATR can come from a crash or a rally.
- It depends on the timeframe. A 4H ATR and a 1D ATR measure different things. Always say which chart you are measuring on.
Honest note: ATR does not predict anything. It is a ruler, and a ruler cannot tell you what to build. It will not tell you where price is going or whether a level will hold; it only keeps your distances honest. Anyone using it to claim a precise target is asking too much of it.
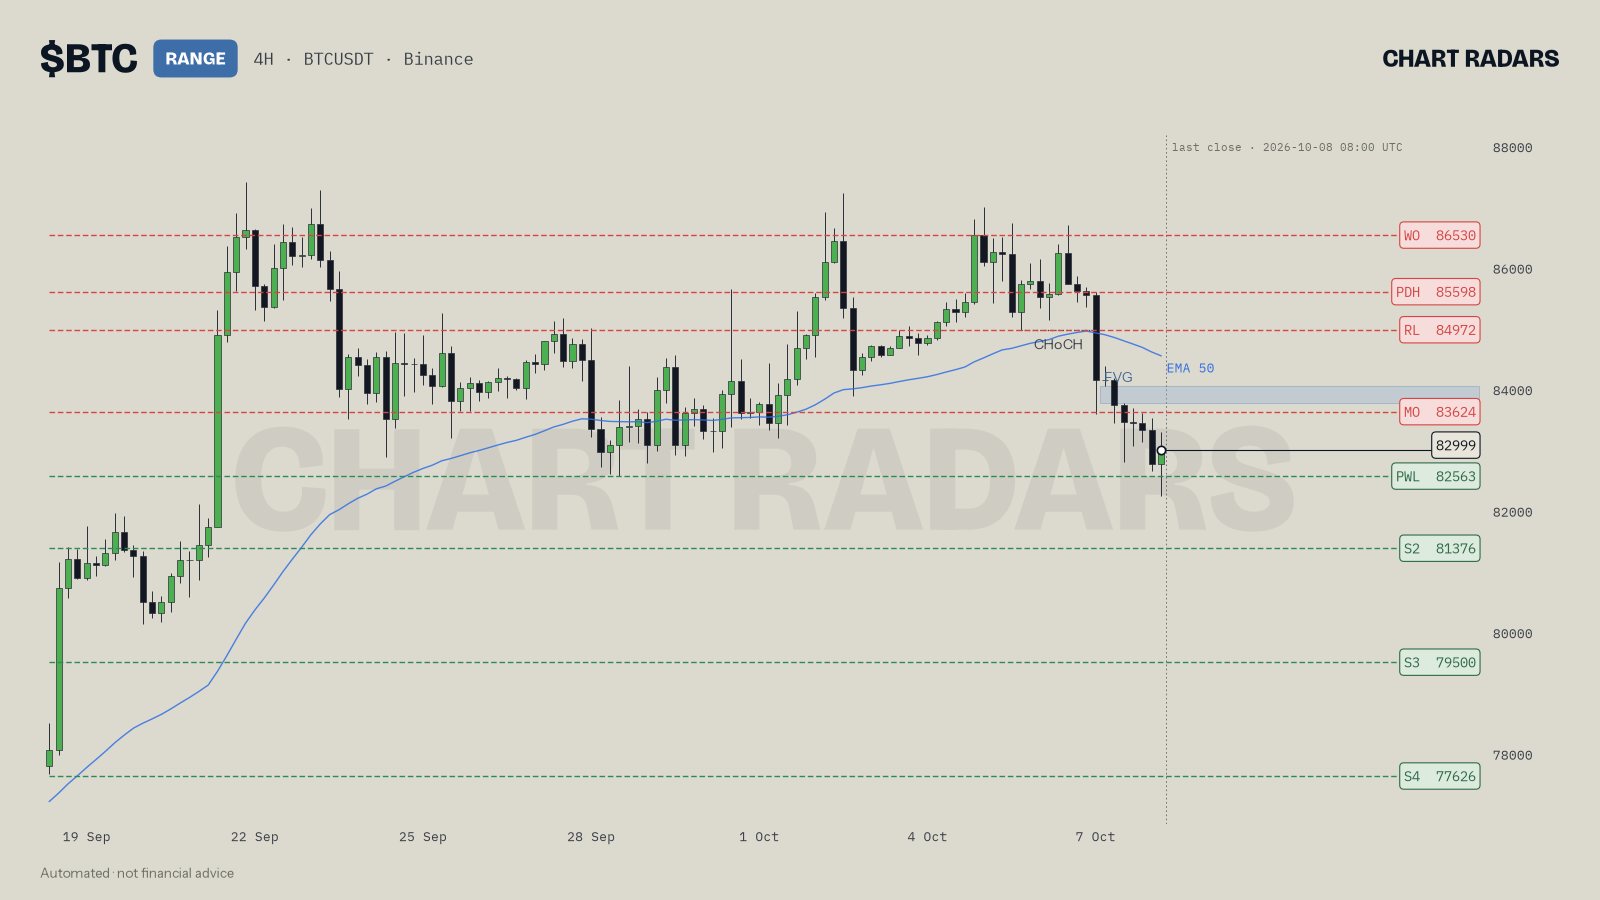
On BTC 4H, close of 8 Oct 2026, the read frames a range from 82563 (the prior-week low) up to the 83624 monthly open. That is about 1060 points, roughly 1.3% of price. On LINK 4H, close of 8 Oct 2026, the range runs from 12.70 to 13.15, about 0.45 points, roughly 3.4% of price (our arithmetic, not a bot figure). In percent the two ranges look nothing alike, and in raw price they cannot even be compared. In ATR they can: each range is some number of typical candles tall on its own chart, and that is the unit the read's thresholds use.
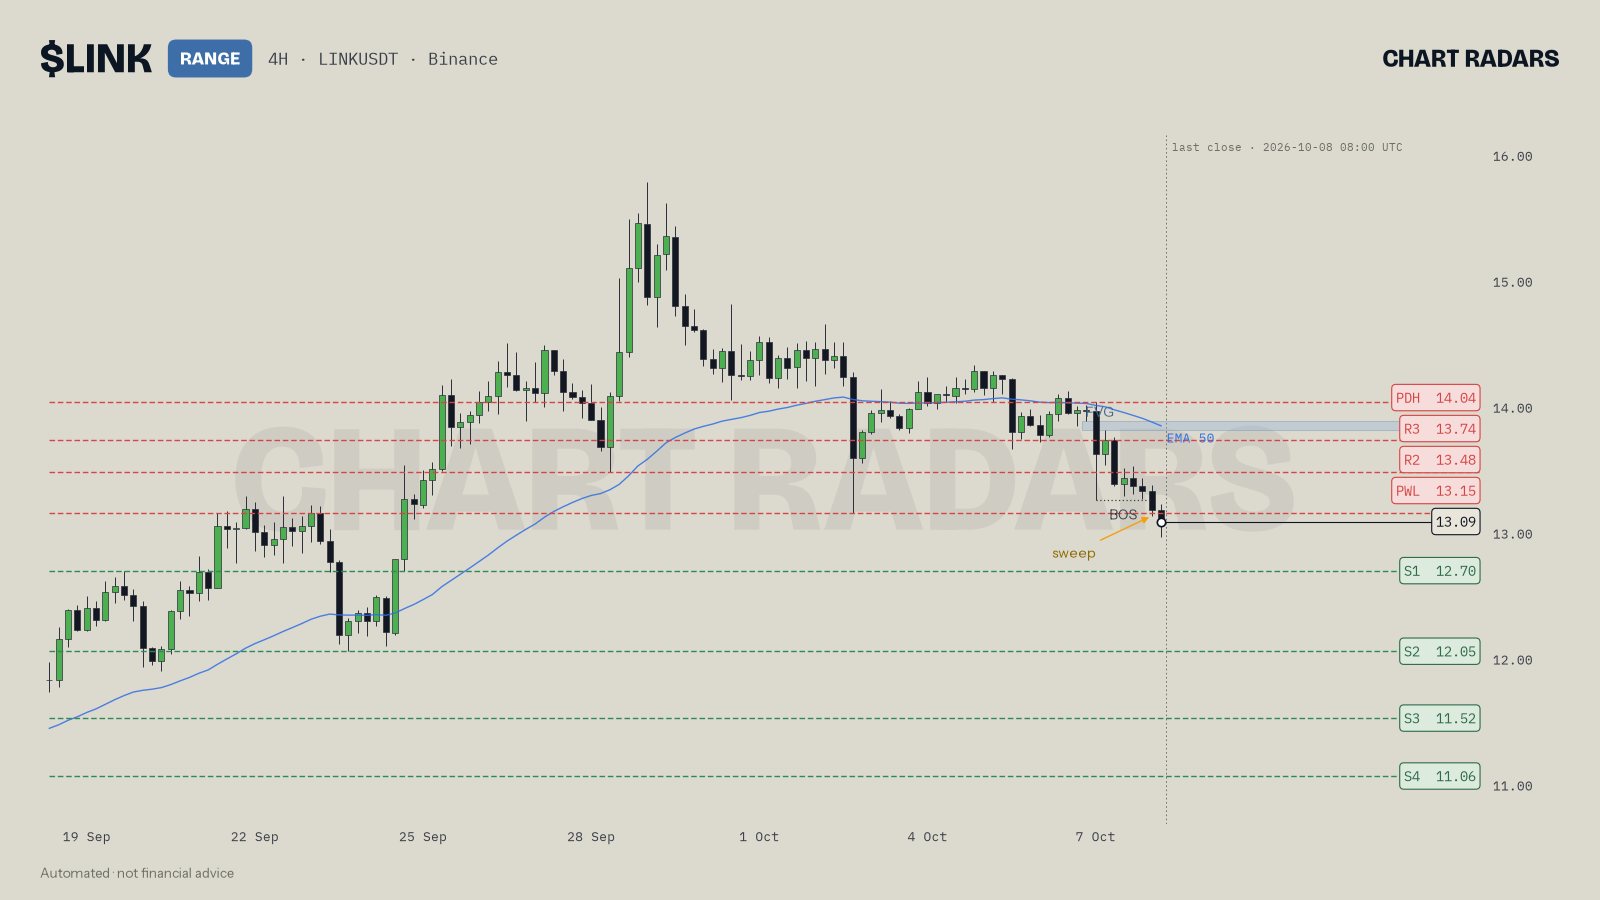
On the LINK chart the read says there is no edge in the middle of the 12.70 to 13.15 range and that it would act only at the edges. To judge how much room that range really offers, the read's own yardstick is the one to use: how many ATR separate the two edges, not how many percent.
In Chart Radars: ATR is 14 candles with Wilder smoothing, and every threshold is a multiple of it. Swing points closer than 0.6 ATR merge into one level, and a level counts as tested when a swing sits within 0.3 ATR of it. Equal highs or lows must match within 0.15 ATR. A fair value gap must be at least 0.25 ATR wide. A zone allows 0.2 ATR either side of its level, and the protective swing must be between 1 and 6 ATR from the entry. Levels farther than 12 ATR from price are dropped. See support and resistance for how those levels are built.
Key takeaways
- ATR is the typical candle size over the last 14 candles (with gaps counted). It has no direction.
- Measuring in ATR makes distances comparable across coins and across calm and wild periods.
- Use ATR for tolerance ("same level"), to check a stop distance against structure, and to judge whether a move is large.
- ATR checks your stop; structure chooses it. A stop closer than about one ATR is easily reached by noise.
- It lags and is inflated by single spikes. It is a ruler, not a forecast.
Frequently asked questions
What does ATR mean in trading?
ATR stands for average true range. It is the average size of recent candles, usually over 14 periods, including gaps between candles. It measures how much price typically moves per candle, not which direction.
How is ATR calculated?
For each candle, take the largest of three things: high minus low, the distance from the high to the previous close, and the distance from the low to the previous close. That is the true range. ATR is a smoothed average of the last 14 true ranges.
What is a good ATR setting?
14 is the standard and a sensible default. Shorter values react faster and jump around more; longer values are smoother and slower. What matters more is using the same setting consistently.
How do you use ATR for a stop loss?
Place the stop at a structural level (a swing low or high) and check its distance in ATR. If the stop sits very close, a normal candle can hit it by noise; if it sits very far, the trade needs more room than it may offer.
Does a high ATR mean the price will go up?
No. ATR has no direction. A high ATR means candles are currently large, in either direction, so distances that looked big a week ago may now be ordinary.