Range trading is the practice of planning around a market that moves sideways between a defined upper boundary (resistance) and a defined lower boundary (support). The range has no confirmed trend: price keeps returning to the same two areas. Traders treat the edges as the places with information and the middle as the place without it.
Markets spend much of their life in ranges, and many new traders lose patience in them. They take trades in the middle, get stopped by noise, and conclude that "the market is manipulated". The fix is not a better indicator. It is knowing where the edges are, what a good test of an edge looks like and which candle ends the range.
What is a range?
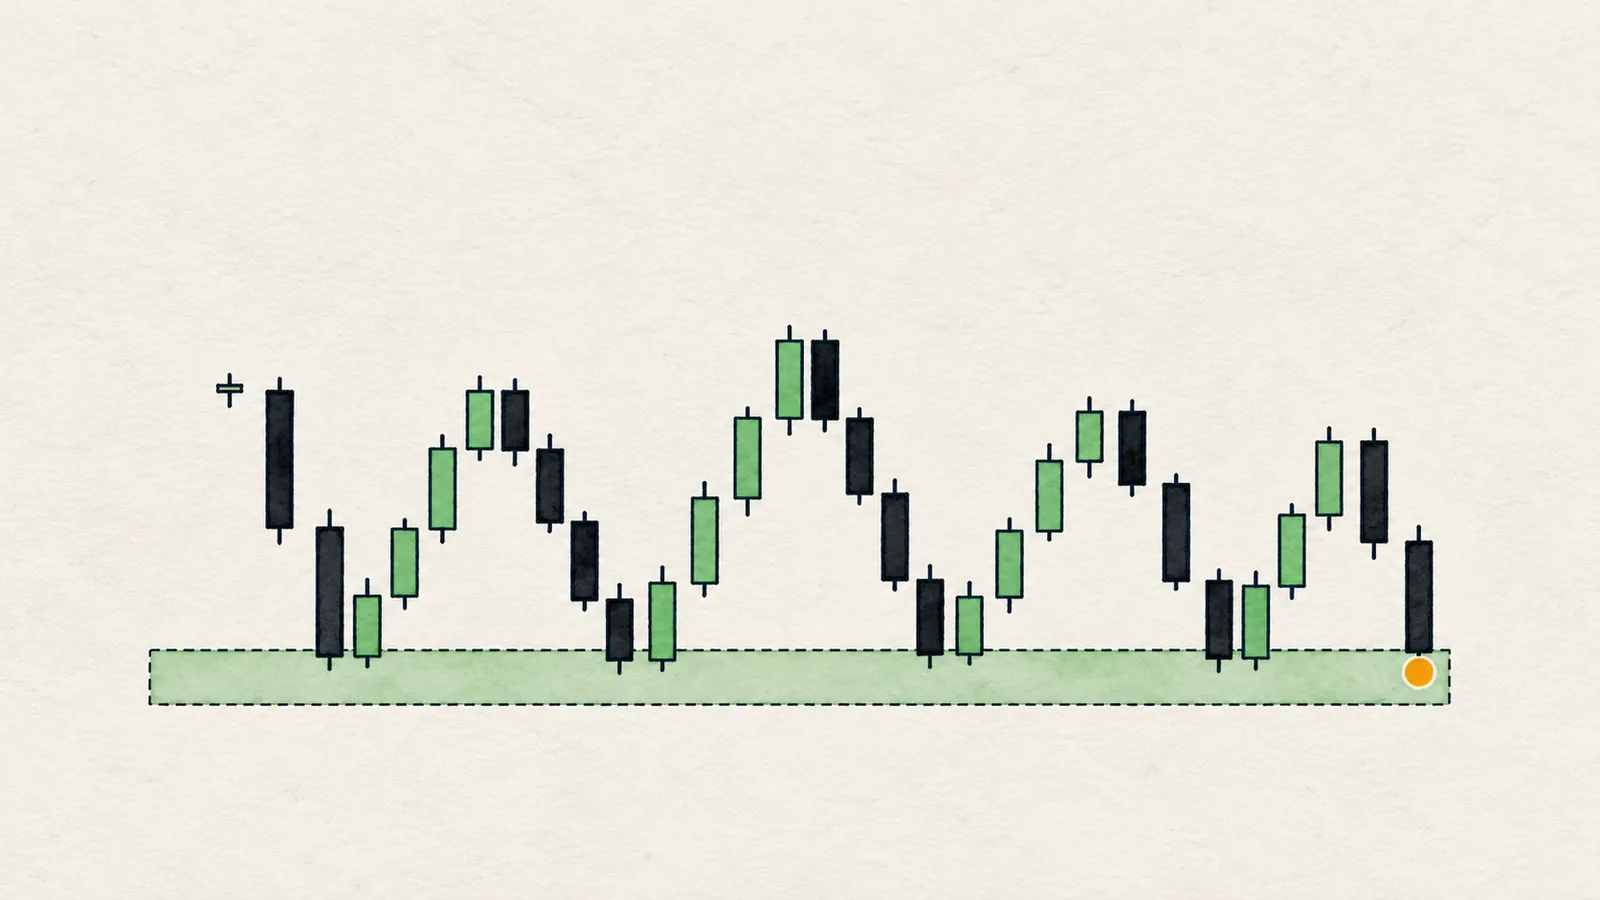
A range is a stretch of price where highs and lows stop getting higher or lower and instead cluster. In market structure terms, there is no clean staircase: you get mixed swings (a lower high but a higher low, for example), or highs and lows that repeat at nearly the same price. The market is still moving, but it is not going anywhere on this timeframe.
Why does it happen? Usually because buyers and sellers disagree about value at the current price and neither side can push through. It can also be a pause after a strong move. Either way, a range is a statement of balance, not of weakness or strength.
How do you define the edges of a range?
A defensible range has evidence on both sides. Use this checklist:
- Find two or more swing highs at nearly the same price. That is the upper edge.
- Find two or more swing lows at nearly the same price. That is the lower edge.
- Check that price has travelled between them at least once, not just touched one side twice.
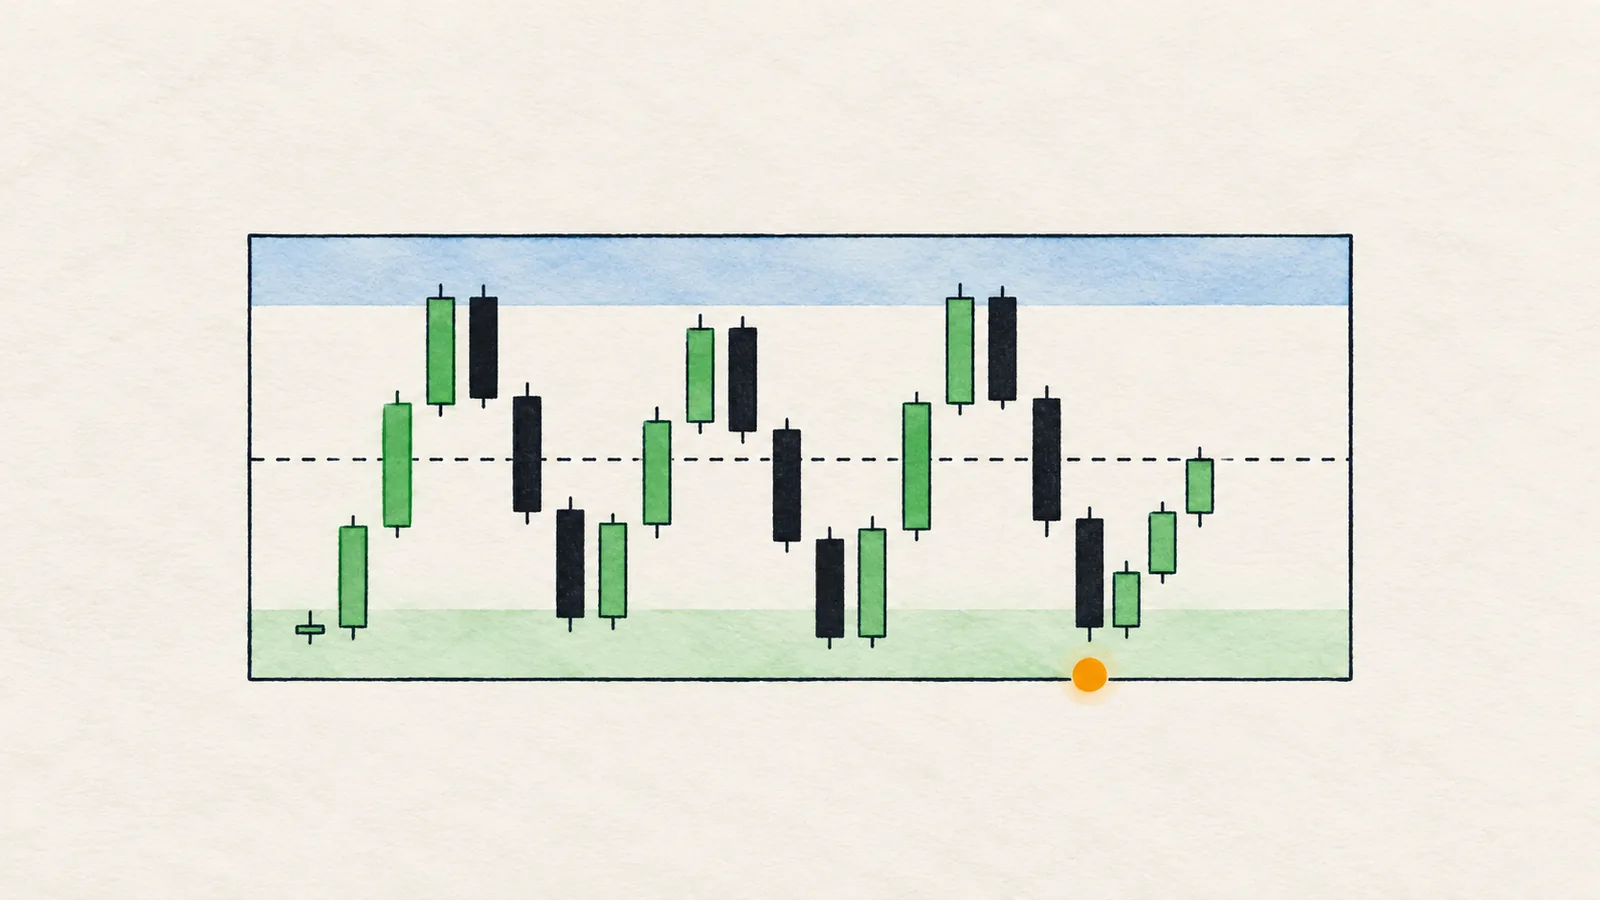
- Draw each edge as a thin zone, around half a candle tall, rather than a razor line. Wicks and spreads mean exact prices rarely hold. The support and resistance guide covers how clustered swings become a zone.
- Scale the distance with volatility. Ask how wide the range is compared with a typical candle. Measured in ATR units, a range only two or three candles tall is barely a range; one fifteen candles tall has room to trade.
Notice that an edge is something you confirm with several touches, not something you declare with one. If you can only find one touch on a side, you have a level, not a range.
What is the midline, and why does the middle have no edge?
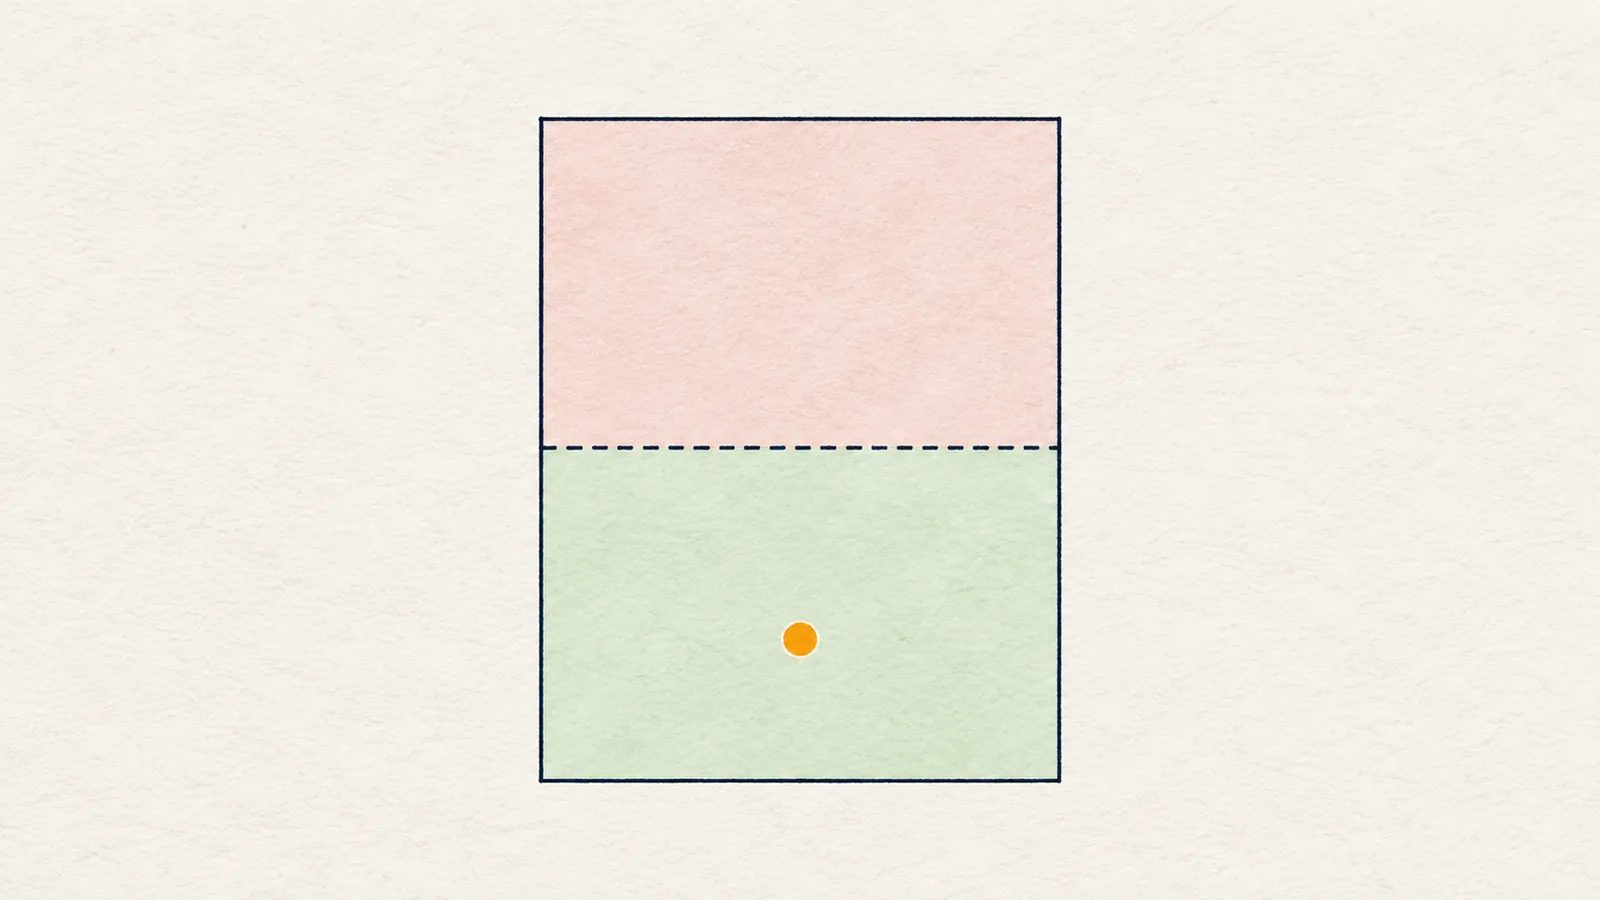
The midline is the halfway price between the two edges. It is not a support or a resistance. It is just arithmetic. Here is why it matters.
Take an imaginary range between 100 and 110. The midline is 105.
- A long near 100.5 with a stop under 99.5 risks about 1 point to try to reach 110, roughly 9.5 points of room.
- A long at 105 with the same logic needs the stop below 100, so it risks about 5 points for about 5 points of room.
Same range, same idea, but from the middle the risk is five times larger and the reward is roughly half. Nothing about the chart changed; only your location did. That is what "no edge in the middle" means. You are not saying price cannot go up from 105. You are saying the arithmetic of being wrong is much worse than the arithmetic of being right.
The premium and discount idea is the same logic: the lower half of a range is where buying is cheaper, the upper half where selling is. The midline is where that distinction disappears.
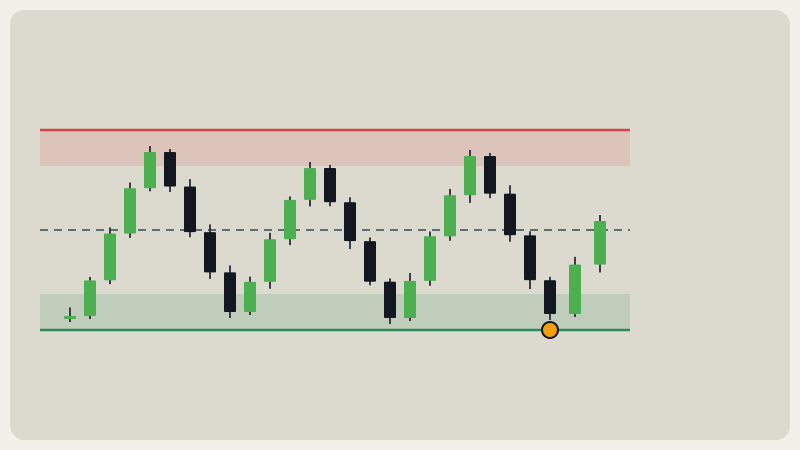
Tip: Draw the midline on the chart and decide in advance to do nothing while price sits near it. Not trading is a position.
How do you trade the edges of a range?
The edges are where plans start, and they give you two kinds of if/then statements.
- Rejection: "If price reaches the upper edge and a candle closes back below it with a long upper wick or a bearish structure break on a lower timeframe, I can plan a short back toward the middle or the other edge."
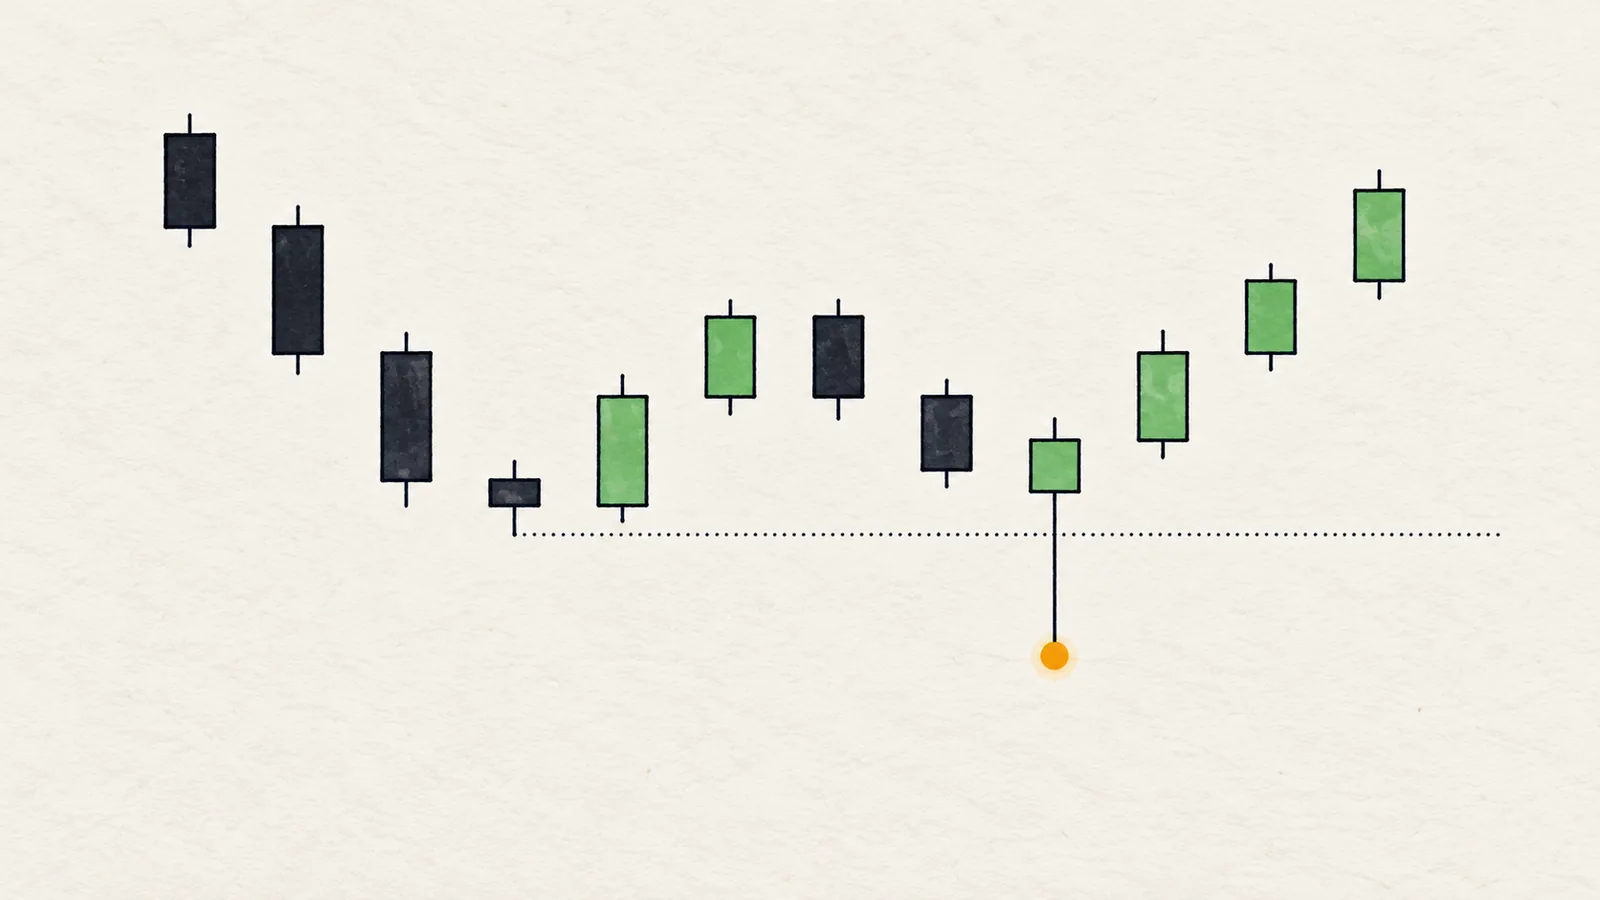
- Sweep and reclaim: "If price wicks below the lower edge, takes the stops under it and then closes back inside the range, I can plan a long back toward the midline or the upper edge."
In both cases the invalidation is clear and close: a candle close beyond the edge on the timeframe you use. If price accepts outside the range, the idea is wrong and you step aside. The distance from the edge to that invalidation is your risk, and it is small because you are trading at the boundary.
A sensible target is the opposite side of the range, or at least the midline as a first checkpoint. Taking a position at an edge and expecting a breakout of the other edge is a different trade with a different risk.
What happens when price sweeps a range edge?
Range edges are where many stops and breakout orders sit, so they are natural magnets. Price often pokes through an edge, collects those orders and then returns. That is a liquidity sweep: a wick beyond the level with a close back inside.
The distinction that matters is again close versus wick:
- Wick beyond, close inside: the edge held. Many range traders treat this as the best version of a test, because stops were taken and price failed to stay outside.
- Close beyond: the edge failed. That is a breakout attempt, not a sweep, and the range is no longer a safe assumption.
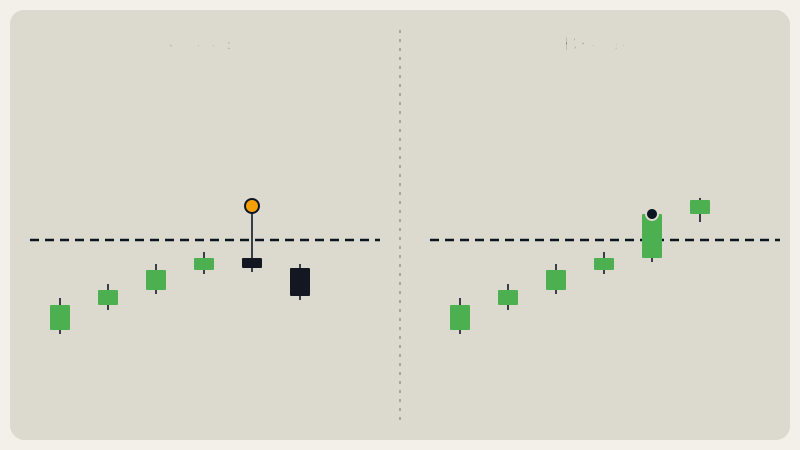
Be careful not to promise yourself a reversal after every sweep. A sweep tells you price failed to hold beyond the edge for one candle. It does not tell you the next candle will not push out again.
What ends a range?
The most useful definition is simple: a candle close beyond an edge on your timeframe. Everything else is a clue, not a verdict.
Clues that make a breakout more credible:
- A strong close, with the body finishing near the high or low of the candle rather than a half-hearted close just past the line.
- Volume that picks up, compared with the recent average. See volume confirmation for how to read it.
- Structure that agrees: a break of structure in the same direction, with the broken edge held on the retest.
Clues that argue for caution:
- Quiet volume on the close, which suggests a thin push.
- A close just beyond the edge with an immediate return inside, the classic fakeout covered in the breakout and retest guide.
- A higher timeframe pointing the other way, which makes the breakout a counter-trend move.
The honest picture is that most breakouts need a few candles to prove themselves, and the first close is only the start of the question.
How does a range look on real charts?
A range with price near the middle: BTC 4H, close of 8 Oct 2026
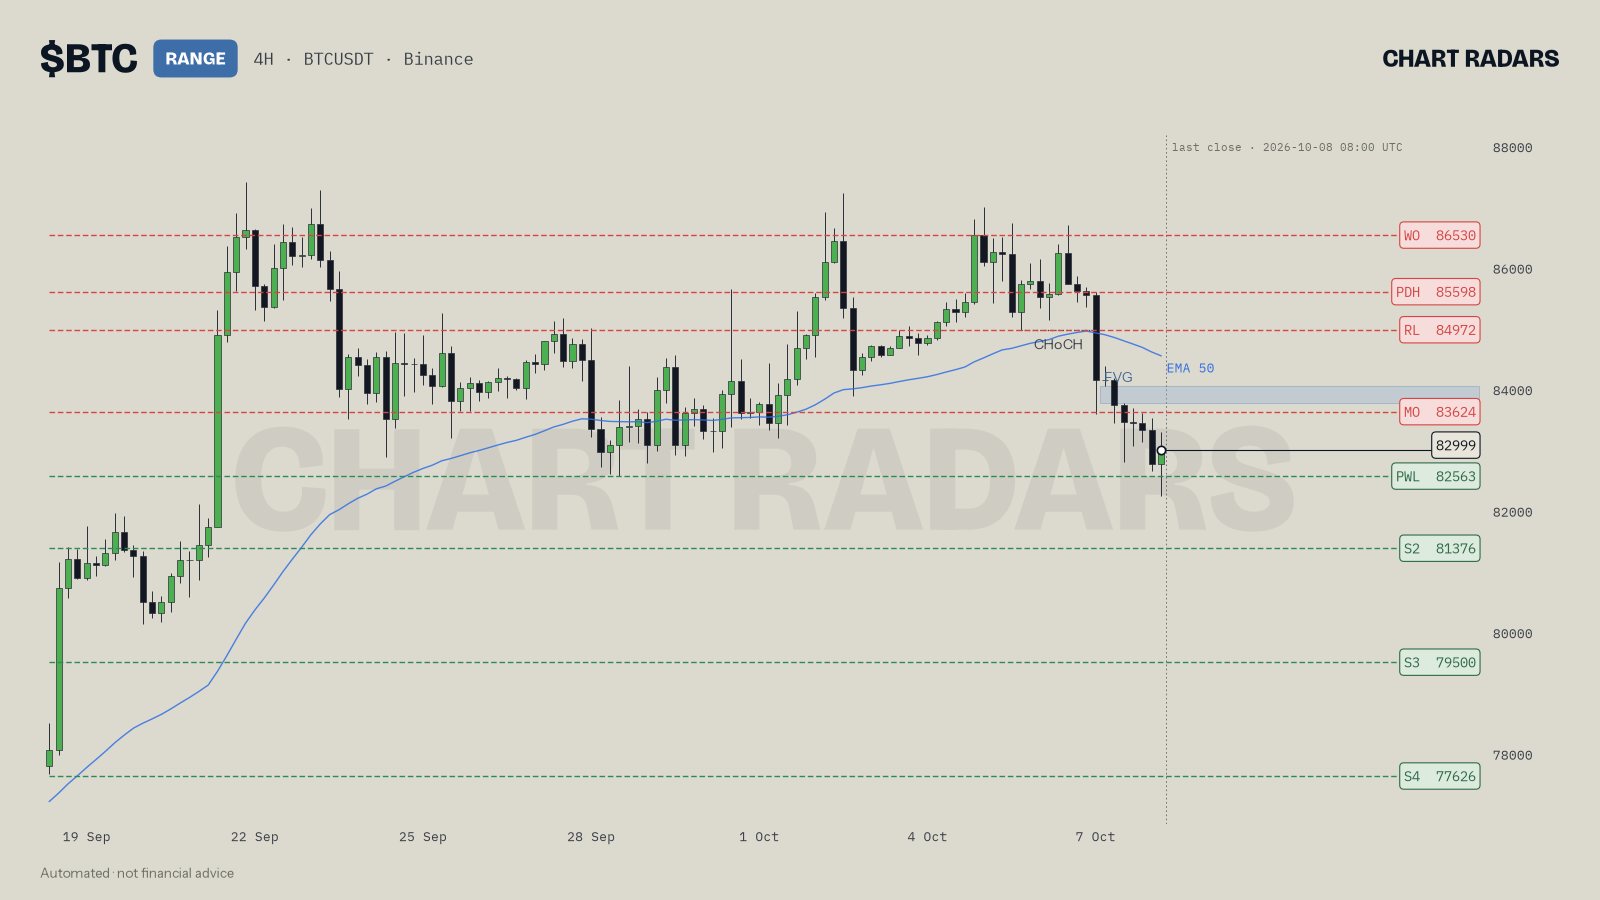
The chart is labelled RANGE, which is how the chart shows a neutral bias: the read has 4H bearish while 1D and 1W are bullish, and the 4H structure itself is mixed (lower highs but higher lows). The range the read works with is 82563 to 83624: the lower edge is the 82563 prior-week low and the upper edge is the 83624 monthly open, which has been tested 2 times. The midpoint of those two edges is about 83094 (our arithmetic) and price closed at 82999, just under it, which is why the read says it has no edge in the middle and would only act at the edges: a long after a sweep and reclaim of 82563, or a short after a rejection at 83624. The read adds the exit conditions. A 4H close above 83624 ends the range, with 84972, 85598 and 86530 as the next stops; a close below 82563 ends it too, with 81376, 79500 and 77626 below. Volume at 1.2 times average is described as ordinary participation, so a breakout would still have to prove itself.
A range with price near an edge: LINK 4H, close of 8 Oct 2026
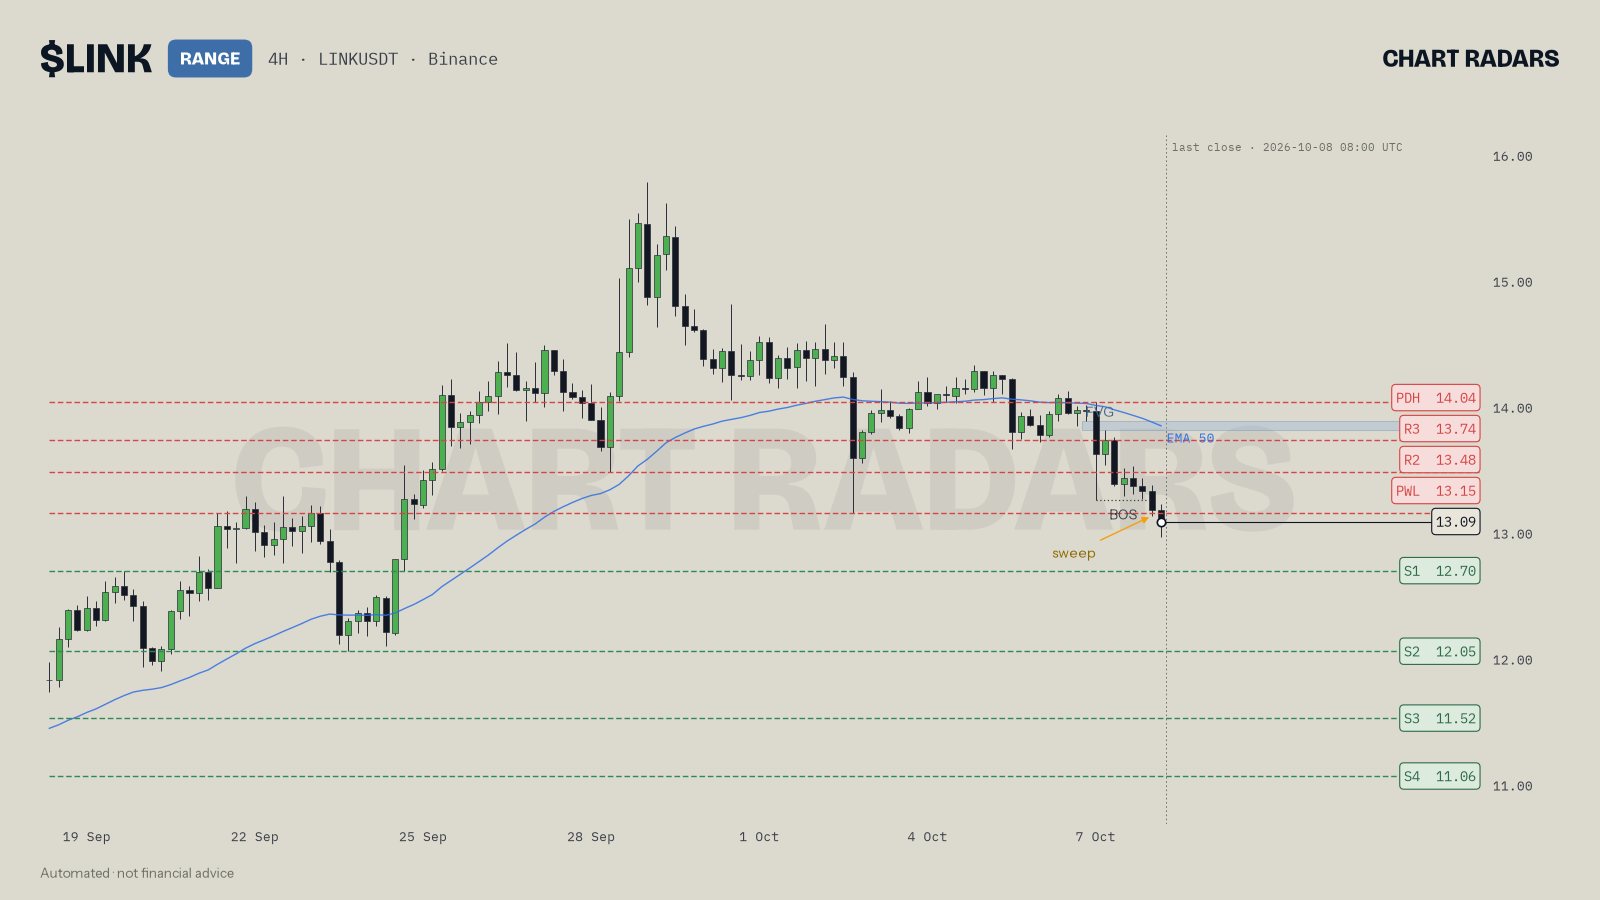
Same label, different location. The read puts the LINK range at 12.70 to 13.15, with the 12.70 level tested 3 times as the lower edge and the 13.15 prior-week low as the upper edge. Price closed at 13.09, only 0.06 under the top edge (our arithmetic), so the nearer plan is the upper one: a short only after a rejection at 13.15, and no short from here without it. The chart also carries a sweep marker on the latest candles. A 4H close above 13.15 would end the range, with 13.48, 13.74 and 14.04 next; a close below 12.70 would end it too, with 12.05, 11.52 and 11.06 below. Volume at 1.4 times average is called ordinary, again leaving a breakout to prove itself.
In Chart Radars: The chart label is the overall bias across timeframes, and RANGE means neutral: no side has more timeframes than the other, or the chart you opened is against them. Separately, the trend read says range when any of three conditions fails: structure (HH+HL for a rise, LH+LL for a fall), a close at least 0.3 ATR away from the 50 EMA, or a 50 EMA that has not sloped the same way over the last 10 candles. When the bias is neutral, a full read does not give a directional bias and says there is no edge in the middle; it names the nearest levels as the edges (they are the levels on the map, such as a prior day or week high or low, a monthly open or a swing level, not necessarily the extremes of the visible candles) and plans only for a sweep and reclaim at the lower edge or a rejection at the upper one. A 4H close beyond an edge is treated as the end of the range, followed by up to four next levels at least 0.5 ATR apart. A sweep is a wick past a swing from the last 40 candles during the last 3 candles that closes back inside.
When does range trading mislead?
When the range is too narrow. If both edges are only a candle or two apart, normal noise will hit your invalidation. Skip it.
When a higher timeframe is trending. A range on the 1-hour chart inside a strong daily trend is often just a pause. The break tends to come with the larger move. See multi-timeframe analysis for how to weigh them.
When you start trading the middle out of boredom. This is the most common failure, and the reason this guide repeats the arithmetic of the midline.
Honest note: A range is not an invitation to buy low and sell high forever. Ranges end, often when most traders have just gotten comfortable with them, and an edge that held ten times can fail on the eleventh. Chart Radars reads a range as a map of conditions, not as a prediction that price will stay inside, which is why every range read comes with the close that would cancel it.
Key takeaways
- A range is a market with no confirmed direction: price returns to two areas and the structure is mixed.
- Define edges with two or more touches per side, drawn as thin zones, and mark the midline.
- The middle has no edge because the same idea costs far more risk there for no more reward.
- A wick through an edge that closes back inside is a sweep; a candle close beyond the edge is the usual end of the range.
- Plan with if/then: act at the edges, and write down which close beyond an edge cancels the idea.
Frequently asked questions
What is range trading in crypto?
Range trading means planning around a market that moves sideways between a clear upper and lower boundary. You act near the edges, where the risk is small and defined, and avoid the middle, where price has no reason to prefer either side.
How do you find the high and low of a range?
Look for at least two swing highs near the same price and two swing lows near the same price, with price moving back and forth between them. Draw each edge as a thin zone, not an exact line, and keep it only while price keeps respecting it.
Why is the middle of a range a bad place to trade?
From the middle you are about as far from one edge as from the other. A stop has to sit beyond an edge to make sense, so the risk is large while the room to the target is smaller.
How do you know a range has ended?
A candle close beyond an edge on the timeframe you trade is the usual marker. A wick beyond an edge that closes back inside is a sweep, which does not end the range by itself.
Is a range breakout always real?
No. Many closes beyond an edge are followed by a return into the range. Waiting for a retest of the edge, or for volume and structure to agree, reduces false starts but never removes them.