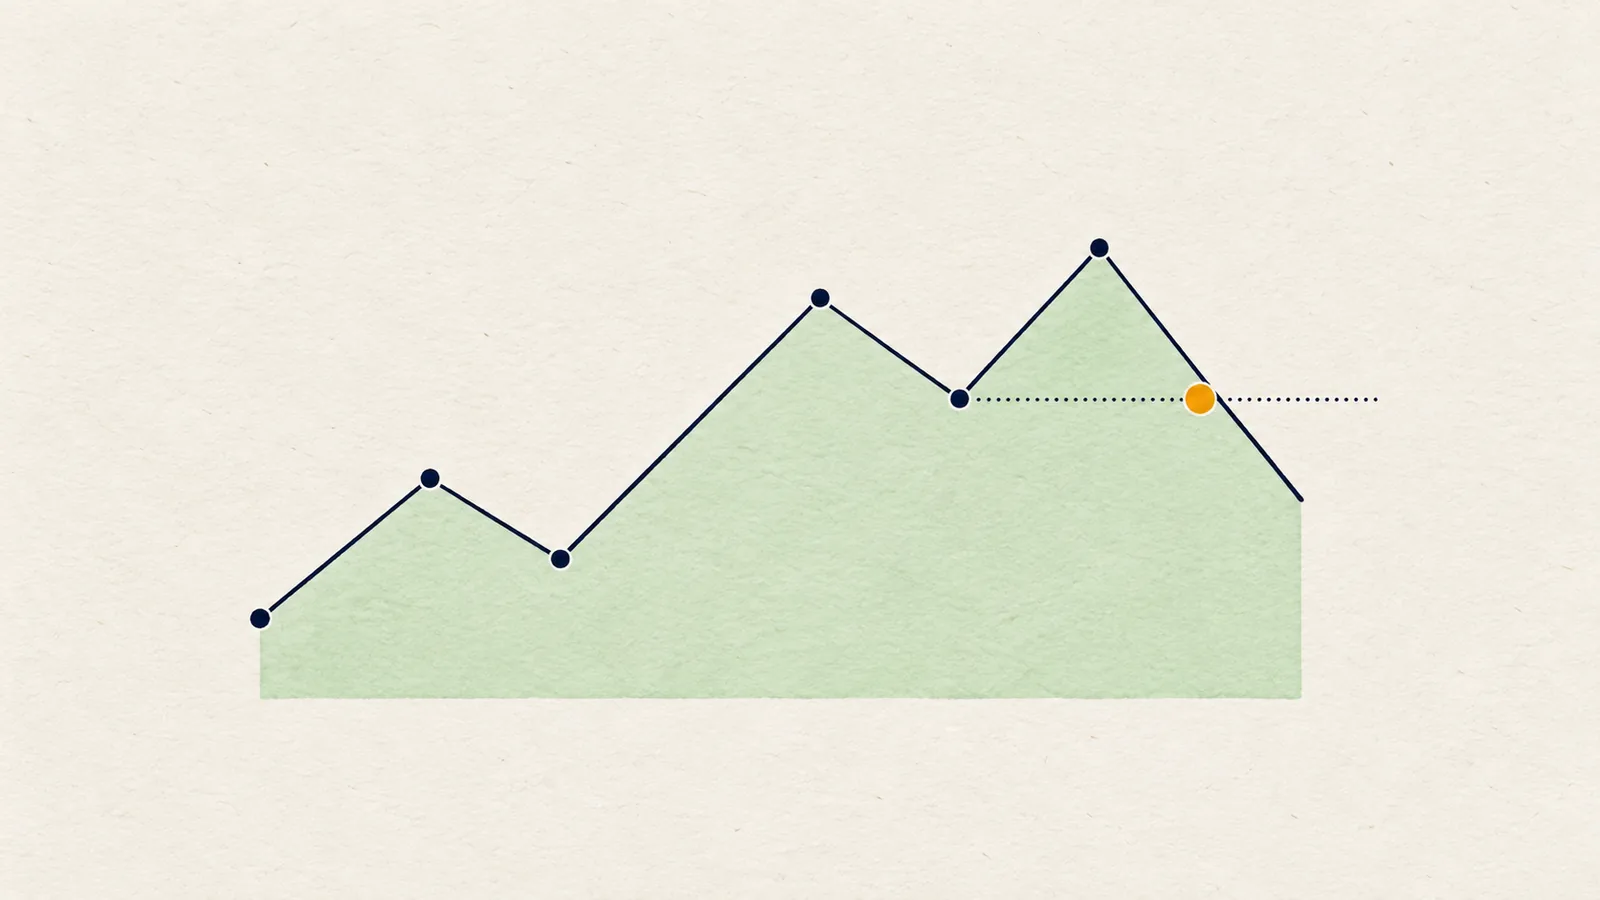
A breakout is a candle that closes beyond a defined level, such as a support, a resistance or the edge of a range. A retest is price returning to that level from the other side to see whether the old barrier now holds the other way. A fakeout is a close beyond the level that is taken back, with price closing inside again.
The three words describe one story at different stages. Price pushes through a level, comes back to test it, and either carries on or fails. Most of the pain in trading breakouts comes from treating the first moment of the story as the whole story. This guide explains what counts as a break, what a retest should look like, how fakeouts happen, how volume and structure help, and how to plan if/then instead of guessing.
What counts as a breakout?
A close beyond the level, on the timeframe you trade. The wick is not enough.
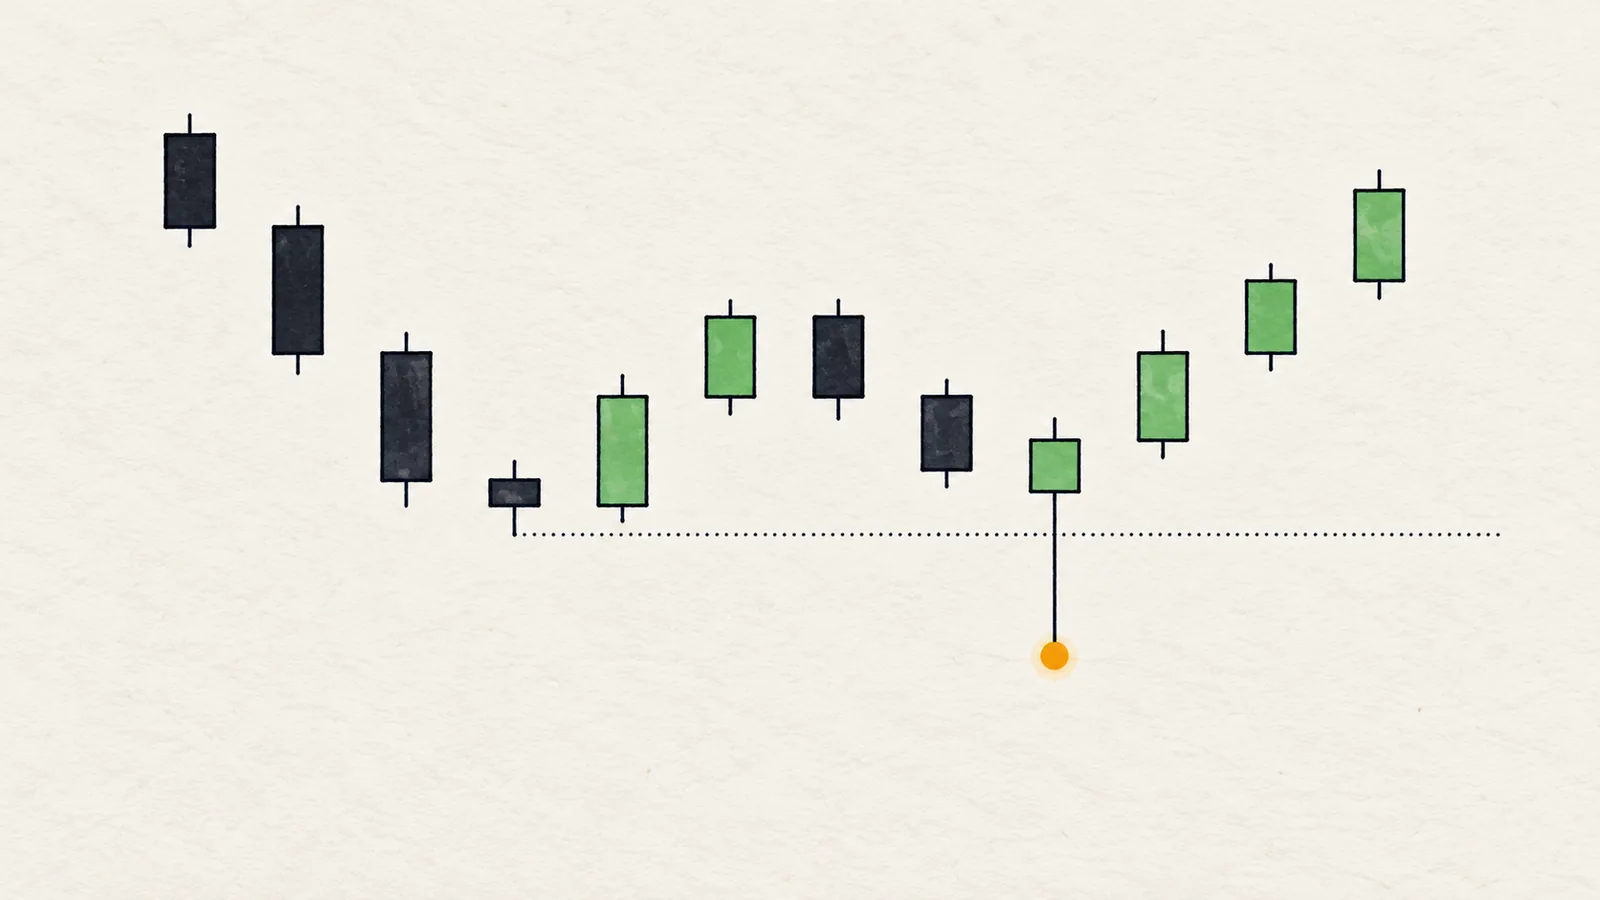
If a candle pokes above a resistance and closes back below it, price visited the level and was rejected. That is the shape of a liquidity sweep, and it is a different event with a different story. If the candle body closes above the level, price was accepted there at the end of a full period, and that is the break.
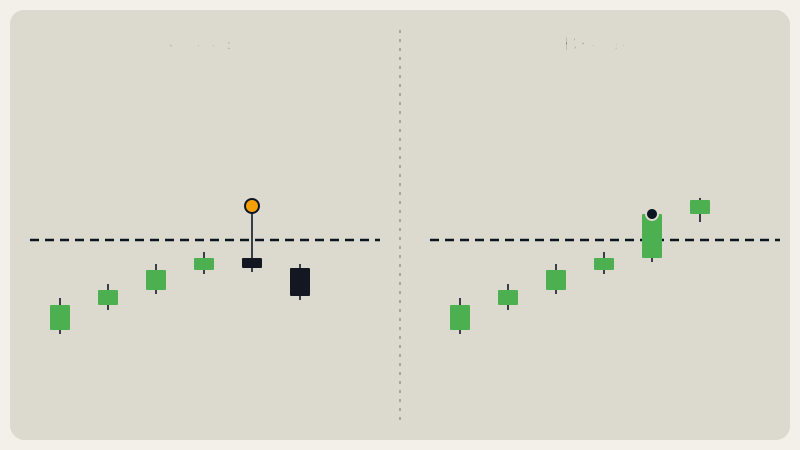
This is the same close rule used for structure. A close beyond the last confirmed swing is a break of structure, either a continuation or a change of character; the BOS vs CHoCH guide covers that. A level-based breakout and a structure break are close cousins: both ask whether price was accepted beyond a reference point.
Tip: Write down the timeframe before you start. A close above a level on the 15-minute chart is not a breakout on the 4-hour chart.
What is a retest?
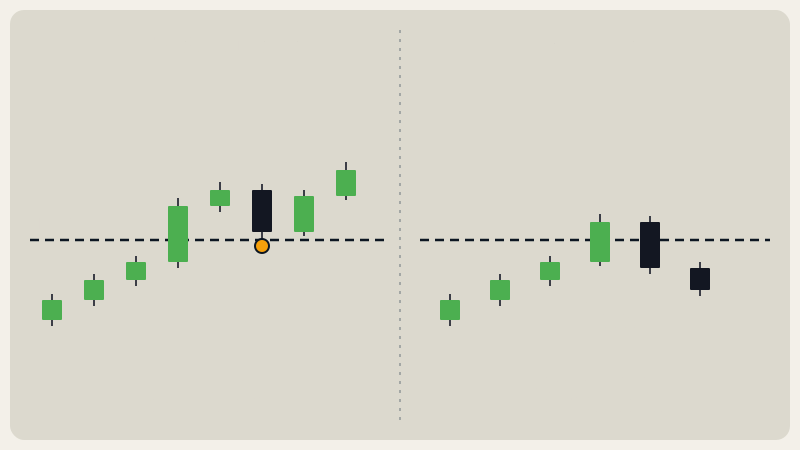
After a break, price often pulls back toward the broken level. A retest is when it touches or approaches that level from the new side, and what matters is the reaction.
- After an upside breakout, the old resistance is tested from above. If it acts as support and price turns up, the retest held.
- After a downside breakout, the old support is tested from below. If it acts as resistance and price turns down, the retest held.
The reasoning is that the level still carries history: orders left there, traders who were on the wrong side and want out at breakeven, and others looking for a cheaper entry. When price returns, those participants often act again. This is a tendency, not a rule, and the retest can also fail simply by price falling back through the level.
A retest is a check, not a promise. A held retest is a better situation than a break with no information; it is still a hypothesis.
What is a fakeout?
A fakeout is a break that does not hold. There are two common versions.
- The wick fakeout: a wick goes beyond the level but the candle closes inside. This is the sweep case. It never counted as a break.
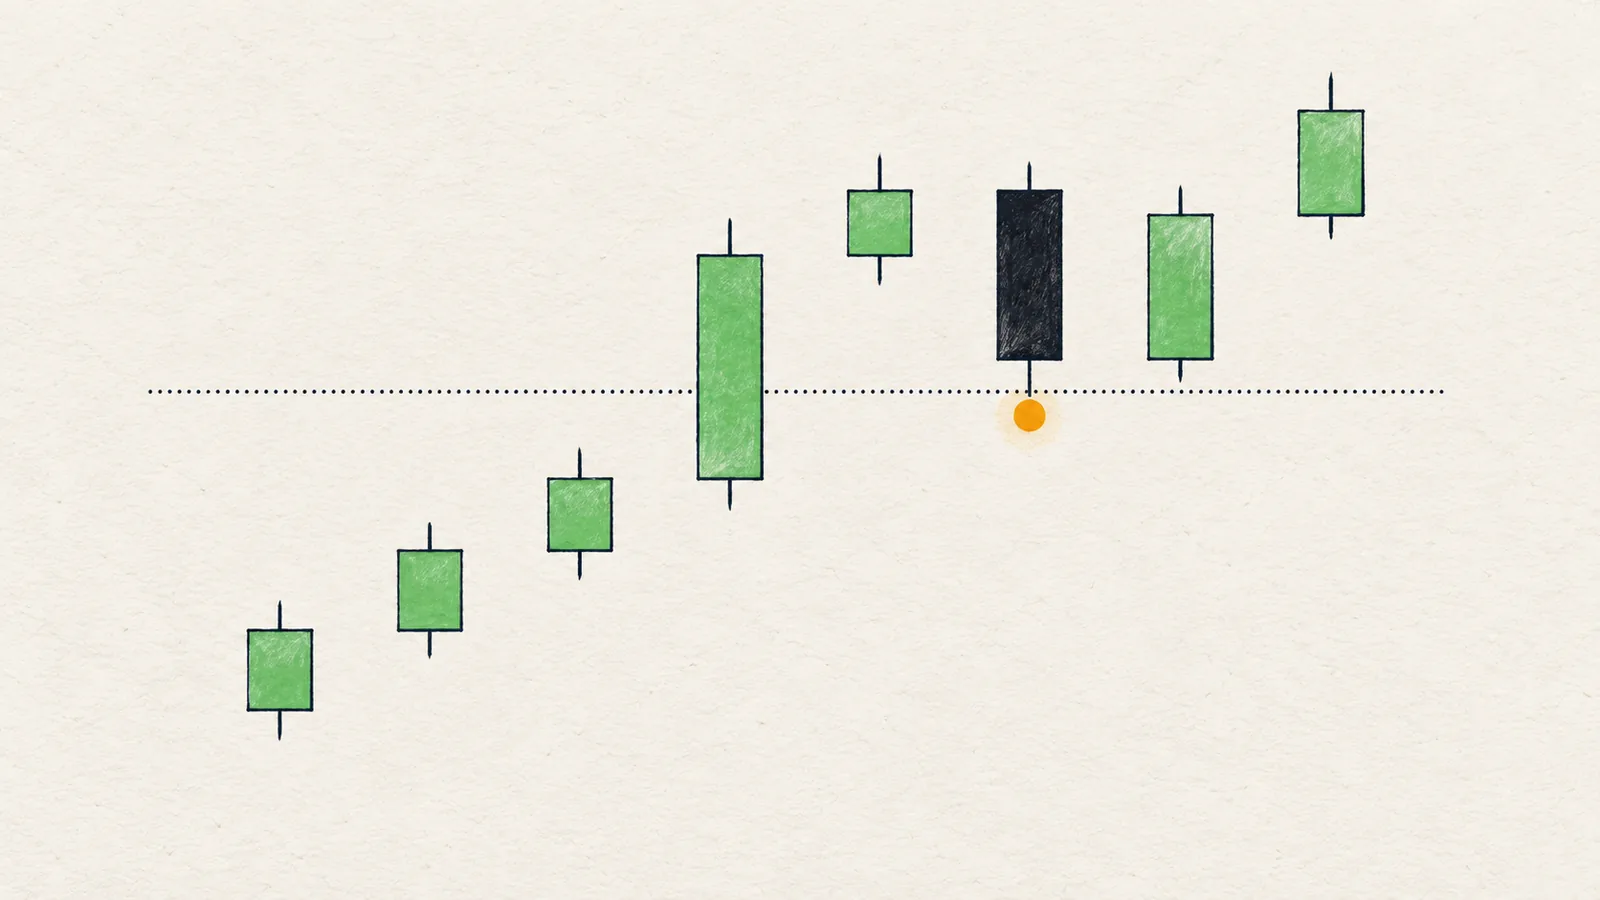
- The close fakeout: a candle closes beyond the level, so by the rule it is a break, and then a later candle closes back inside. Traders who bought the close are now holding a loser.
Fakeouts happen because levels attract orders. Stops and breakout entries cluster just beyond an obvious level, so price can be pushed through to reach them and then return when there is no more follow-through. Also, a close that is only marginally beyond a level, with no momentum and no volume, is not much evidence of acceptance.
You cannot avoid fakeouts entirely. What you can do is decide in advance what you will do if the close is taken back, which is the invalidation, and keep the loss small.
How do volume and structure help?
Neither can prove a breakout, but both shift the weight of evidence.
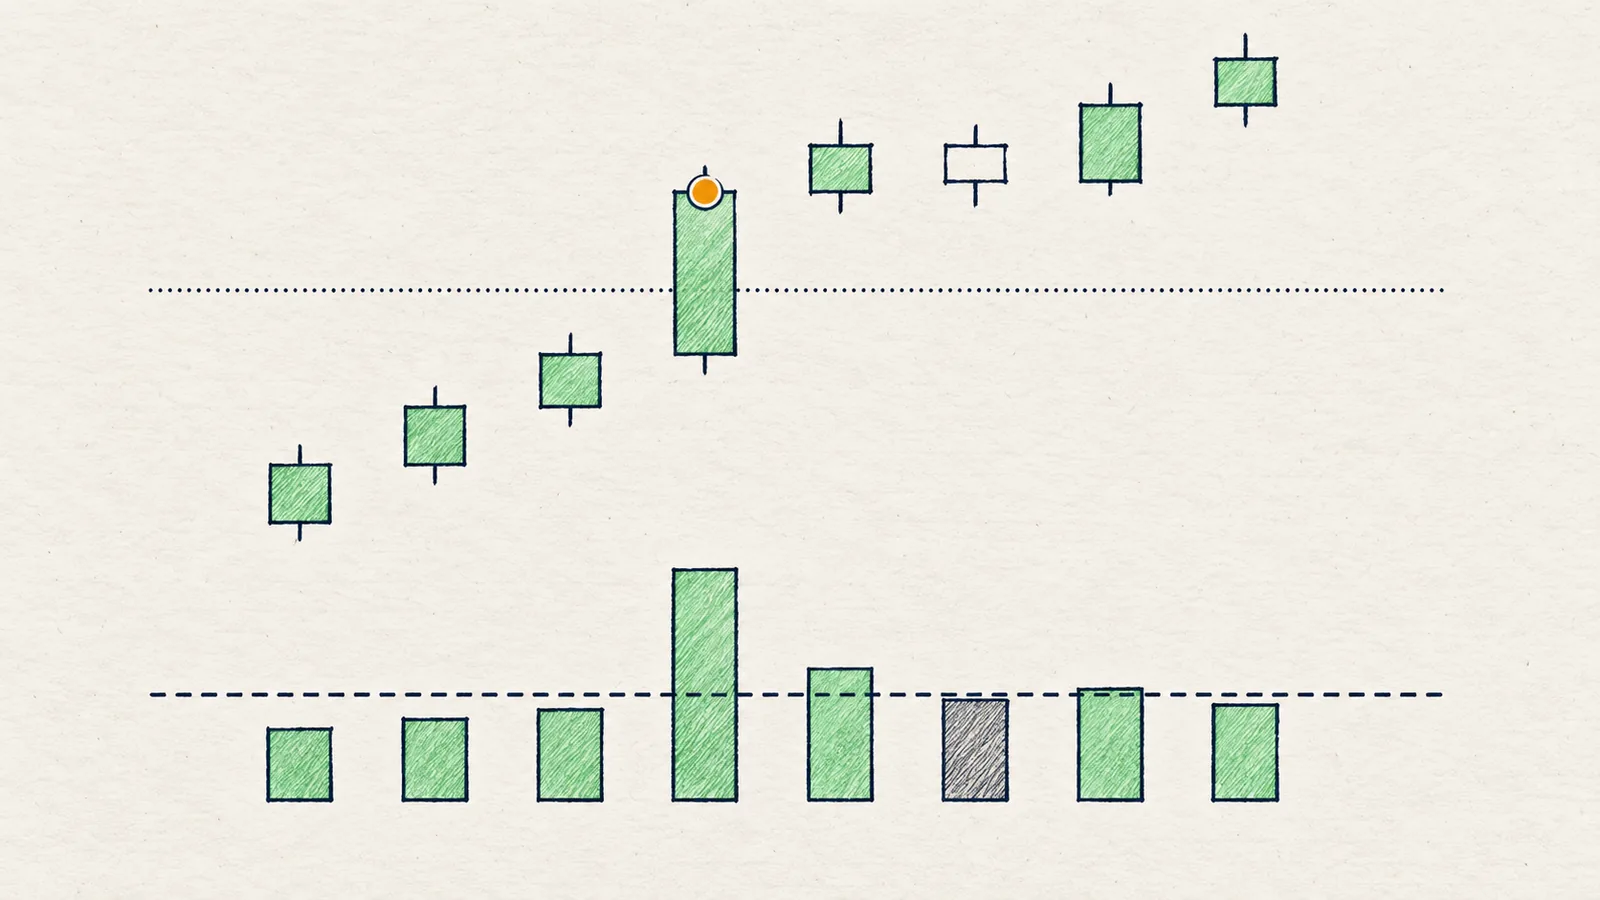
Volume. Compare the breakout candle's volume with the recent average. A close beyond a level on well above average volume suggests more participation behind the move; a close on quiet volume suggests few people cared. See volume confirmation for how to read it. It is evidence about participation, not about direction after the break.
Structure. Ask whether the break fits the bigger picture. A break in the direction of the higher-timeframe trend has fewer reasons to fail than a break against it. A break followed by a pullback that holds above the old level and then makes a new swing in the direction of the move is a better story than a break followed by a lower close.
Candle quality. A body that closes near the extreme of the candle, beyond the level by a meaningful distance, is stronger than one that barely clears it with a long wick back.
Context. If the level is the edge of a range, a close beyond it ends that range, but the first close is still the start of the question.
How do you plan a breakout trade?
Plan with if/then, with the invalidation first.
- Mark the level and decide which timeframe's close counts.
- Write the trigger: "If price closes above X on the 4-hour chart, the breakout is on."
- Decide the confirmation you need: volume above average, a retest that holds, a structure break, or only the close. Pick before the move.
- Decide the invalidation: "If price closes back below X, the break failed and I step aside." A common choice is the level itself or the retest low.
- Choose the style: enter on the close, or wait for the retest. Entering on the close gets in earlier at a worse price and with more fakeout risk; waiting for the retest gets a better price but may never get filled.
- Set the next level: where do you expect hesitation after the break? The next level up (or down) is the natural first checkpoint.
An illustration with made-up numbers: a resistance sits at 100. A 4-hour candle closes at 101, which is the breakout. The next candles drift back to 100.2 and hold, with the lows staying above 100, which is a retest that held. A trader waiting for that might plan an entry there with the invalidation back below 100 (or below the retest low). If instead the next 4-hour candle closes at 99.5, the break failed, and the plan is already over; the loss is small because the exit was set at the level.
What do breakouts look like on real charts?
A breakout level that comes first: DOT 4H, close of 8 Oct 2026
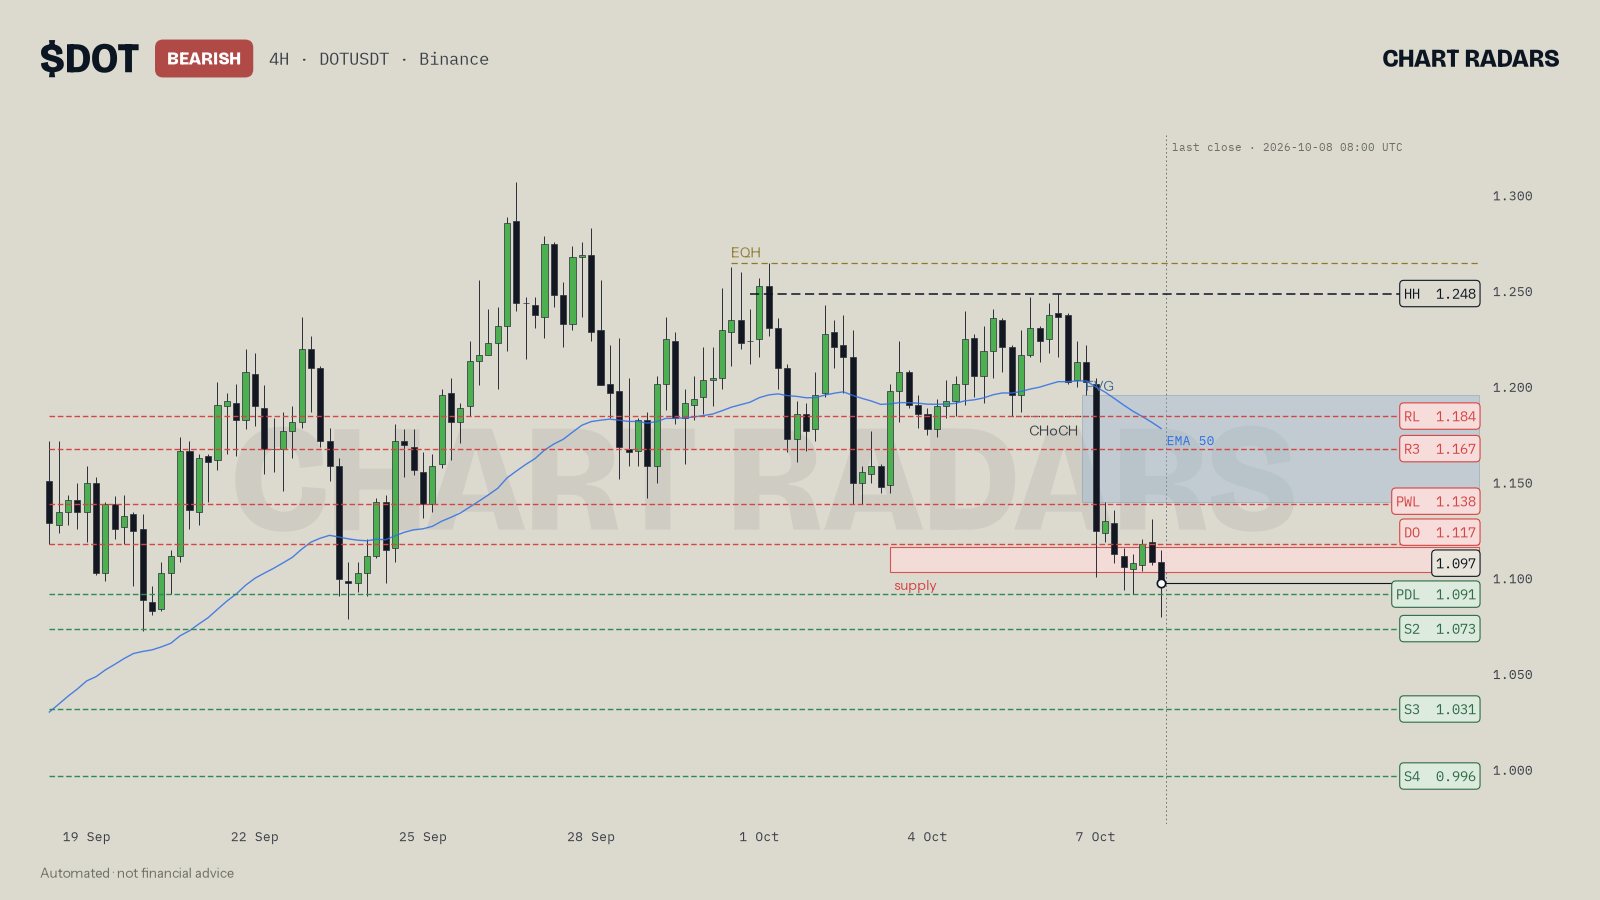
The chart is labelled BEARISH. Price closed at 1.097, close to the 1.091 prior-day low drawn just below it. The read says that, with price pushing into 1.091, the breakout comes first and a pullback second: as long as price keeps closing below 1.091 on 4H, the next steps are 1.073 (tested 3 times), 1.031 (tested 4 times) and the 0.996 swing low. It also says volume is about normal at 1.3 times average, so it wants to see volume expand on the break. In other words, the idea is conditional on a close, and the confirmation it asks for is volume.
A level to beat on a close, with the wick above it: NEAR 4H, close of 8 Oct 2026
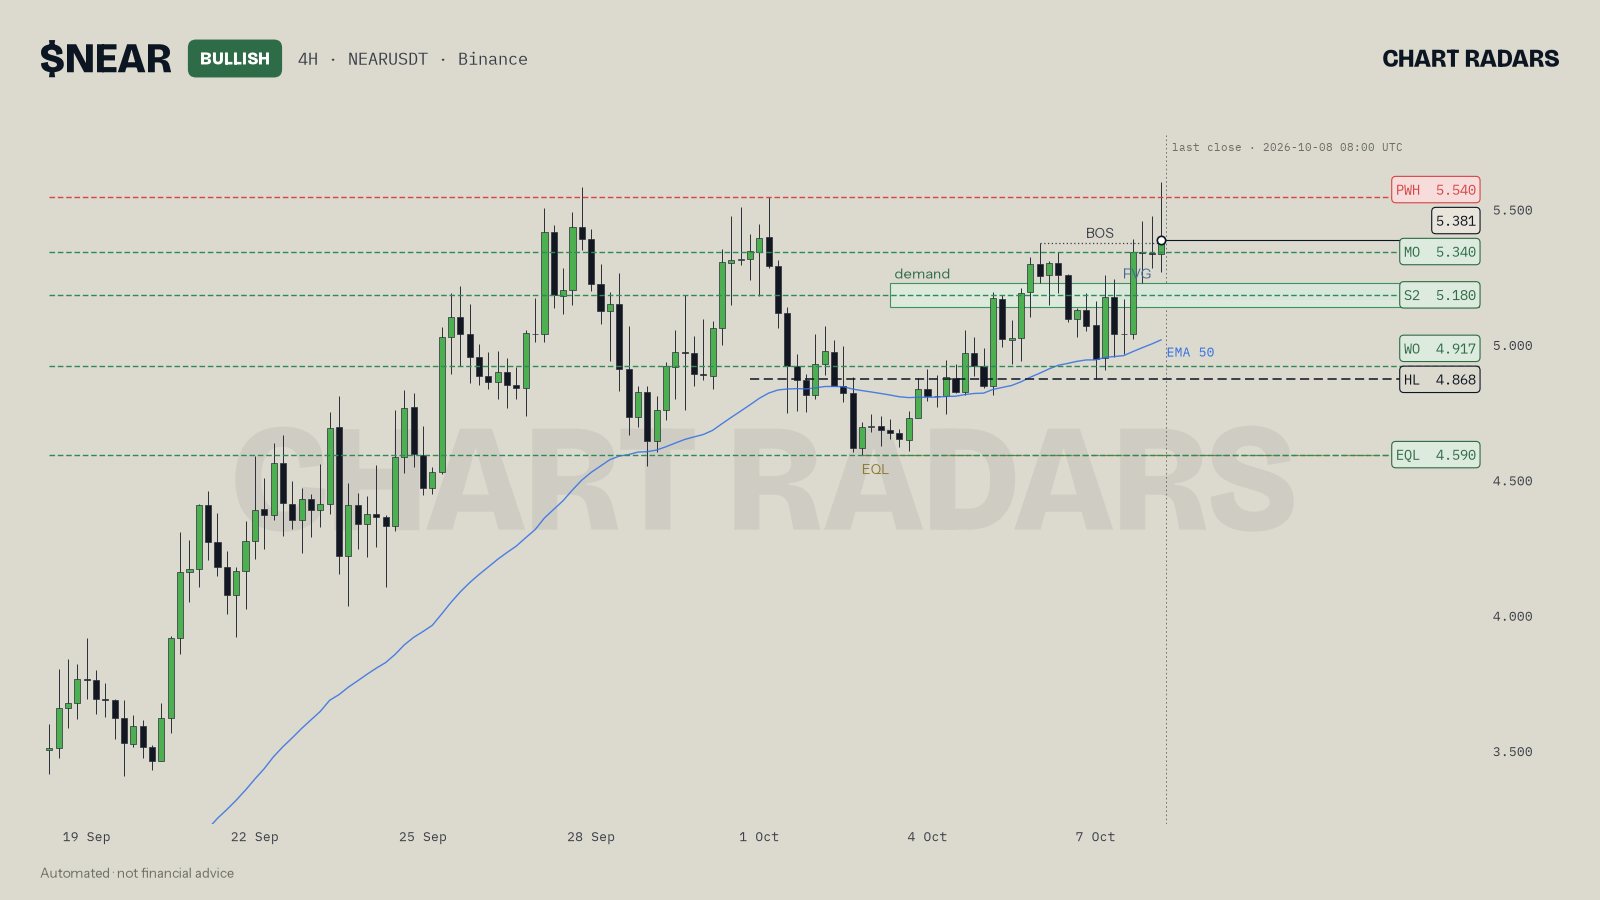
The chart is labelled BULLISH, with a BOS marker. The read names one level to beat: the 5.540 prior-week high (tested 3 times) on a 4H close, once a pullback into the 5.135 to 5.225 demand area holds. Volume is running at 2.3 times its recent average, with buyers dominating, which the read says gives a move fuel. On the chart, the last candle has a long upper wick that reaches above the 5.540 line, while the close is 5.381, below it. That is the wick-versus-close difference in a single candle: price visited above the level, but the close did not accept it, so by the close rule there is no breakout yet.
In Chart Radars: A breakout is a candle close beyond a level on the read's timeframe; the scenarios are written as "if price closes above X on 4H" and "if price closes below Y on 4H", followed by up to four next levels at least 0.5 ATR apart. If the trigger is within 0.5 ATR of price, the plan reads "breakout first, then pullback". Volume is the last candle's volume divided by the average of the previous 20; if rising candles carried at least 1.3 times the volume of falling candles over the last 20, buyers are said to have carried volume (and the reverse for sellers), and the read says it wants to see volume expand on a break. A wick through a recent swing (within the last 40 candles) that closes back inside within the last 3 candles is marked as a sweep rather than a break. Each swing can be broken only once. Retests are not labelled separately.
When do breakouts mislead?
In the middle of a range. Breaks of small, unimportant levels in the middle of a chop are noise. The levels worth caring about are the edges.
On thin volume. A close beyond a level when nobody is trading is easy to reverse.
Against a stronger timeframe. A bearish breakout on the 1-hour chart in a strong daily uptrend often turns out to be a pullback. Check the higher timeframe before trusting a lower-timeframe break.
Right before news. Scheduled events can print a close beyond a level and take it back within hours.
When you chase. Entering far beyond the level after a big candle puts your invalidation a long way off. The risk grows even if the idea is right.
Honest note: Retests and volume spikes improve the picture, but they do not make a breakout safe. Some breakouts never retest, some retests fail, and some perfect-looking breaks reverse within a few candles. Chart Radars writes every breakout as an if/then with the close that cancels it, and it says openly when volume is not yet confirming.
Key takeaways
- A breakout is a candle close beyond a level; a wick beyond that closes back inside is a sweep, not a break.
- A retest is price returning to the broken level from the other side. If the old level holds the other way, the break has passed its first check.
- A fakeout is a break that is taken back, either a wick that never closed beyond or a close that is later reversed.
- Volume above average, structure that agrees and a strong close improve the picture but never prove it.
- Plan with if/then: write the trigger close, the confirmation you need and the close back inside that cancels the idea.
Frequently asked questions
What is a breakout retest?
After price closes beyond a level, it often comes back to touch that level from the other side. A retest is that return. If the old level now holds as support (after an upside break) or resistance (after a downside break), the breakout has had its first check.
What is a fakeout in crypto trading?
A fakeout is a move beyond a level that fails: price closes beyond it, or looks about to, and then closes back inside. Traders who entered on the move are caught on the wrong side.
How do you tell a breakout from a liquidity sweep?
A breakout is a candle close beyond the level. A sweep is a wick beyond the level where the candle closes back inside. If the body closes beyond, it is a break, even if price returns later.
Does a breakout always retest the level?
No. Strong breakouts sometimes keep going without a retest, and weak ones sometimes retest and fail. A plan that depends on a retest has to accept that it may never come.
How does volume help confirm a breakout?
Volume above the recent average on the breakout candle suggests more participation behind the move. Quiet volume suggests a thin push. It improves the odds of a read, but it does not decide the outcome.