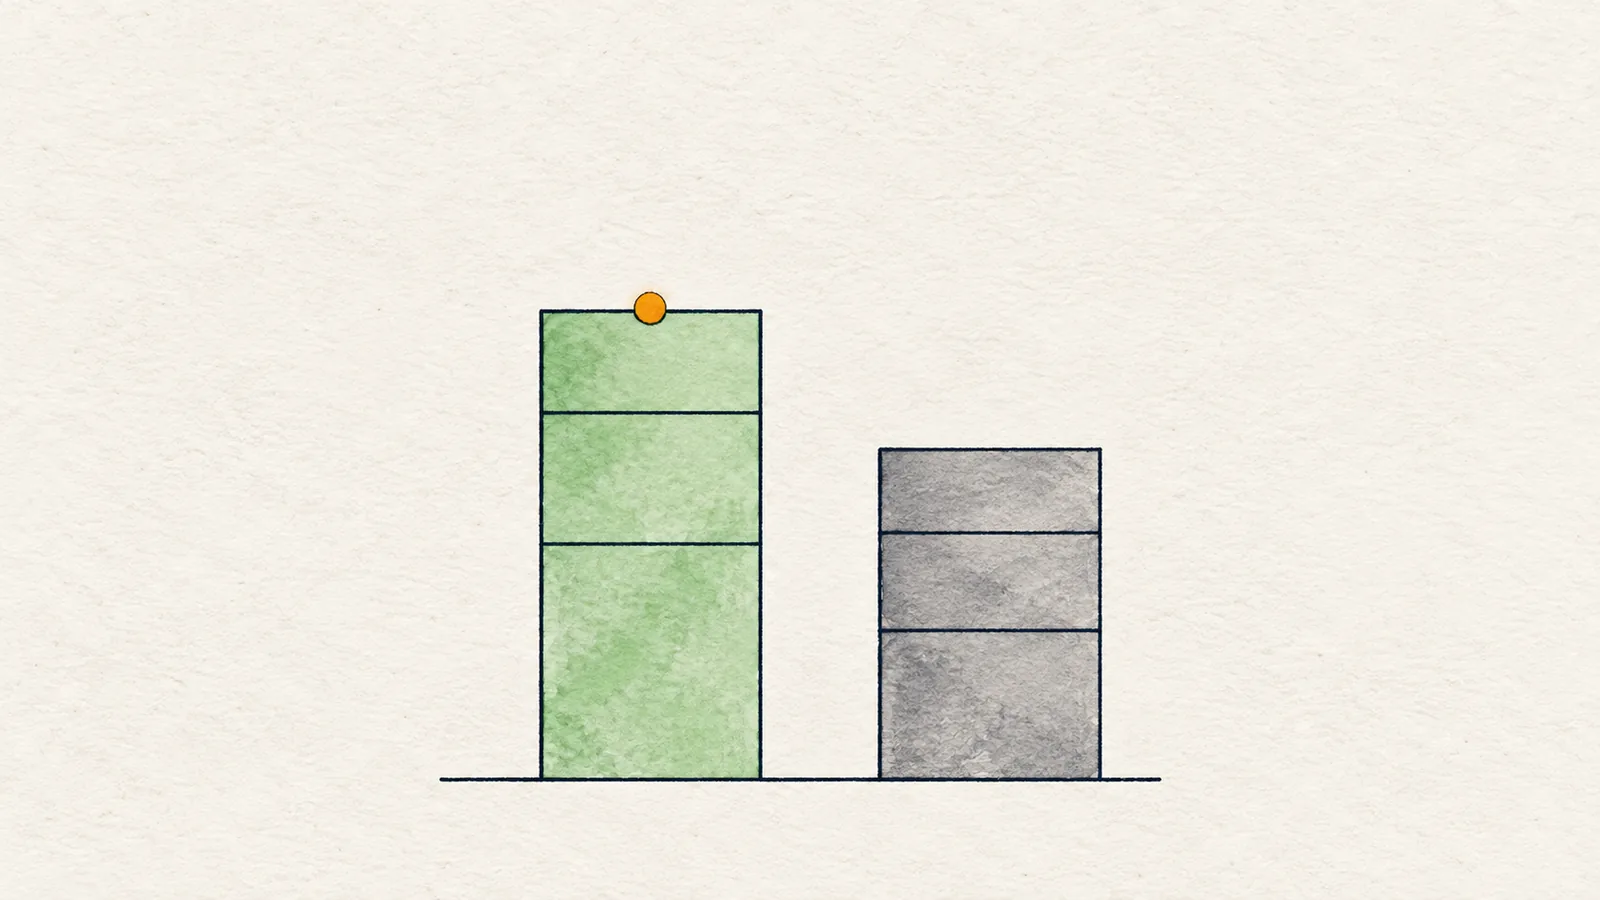
The long/short ratio is a futures-market statistic that compares how many traders, or how much positioning, sits on the long side versus the short side. A ratio of 1 means an even split, above 1 means more longs, below 1 means more shorts. It describes who holds positions, not who is right, and it is often misread.
What does the long/short ratio actually measure?
Futures exchanges and data providers publish a few versions of this number, and they are not interchangeable. The most common one is an account ratio: of the accounts holding a position, how many are long and how many are short. A ratio of 2.0 then means roughly two long accounts for every short one.
Some providers instead publish a ratio weighted by position size, or limited to the largest traders. These can disagree with the account ratio, sometimes sharply, because a few big short positions can offset many small long ones. Always check what a given chart or bot is counting before comparing numbers.
Two things the ratio does not tell you:
- Size. One account with a large short can matter more than hundreds of small longs. A plain account count hides that.
- Intent. A long account might be a trend follower, a hedge against a spot holding, or one leg of a spread. The ratio cannot separate them.
Long/short ratio vs taker buy/sell volume: stock versus flow
The long/short ratio is a stock: positions that already exist. The taker buy/sell ratio is a flow: what aggressive traders did recently.
A taker is a trader who crosses the spread with a market order to get filled right now. Taker buy volume is buying that lifted offers; taker sell volume is selling that hit bids. A taker ratio above 1 means more of the recent aggressive volume was buying, below 1 means more was selling.
Why both matter:
- Accounts can lean long while takers are selling. Positions exist, but the crowd is no longer pressing in that direction.
- Takers can be buying hard while the account ratio is balanced. Fresh aggression is arriving, but the crowd has not committed.
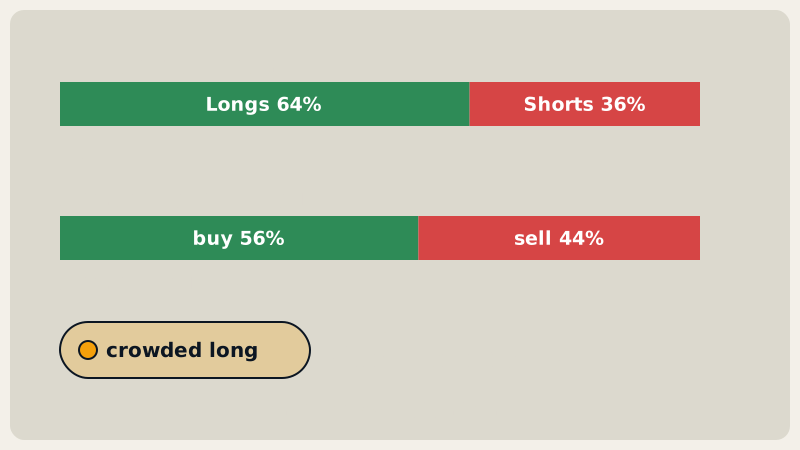
- When the account ratio leans long and takers are buying and funding is elevated, you have three views of the same crowd agreeing. That is the strongest version of "crowded".
Why is a long/short ratio above 2 normal on altcoins?
Retail accounts lean long. Many traders open a futures position because they believe a coin will go up, and shorting is less familiar to newcomers. On altcoins especially, account ratios of 2, 2.5 or higher can sit there for days without anything dramatic happening.
So a reading of 2.4 on a mid-cap coin does not carry the same weight it might on a coin whose ratio usually hovers near 1.2. The useful questions are:
- How high is it compared with this coin's own recent range?
- Are takers and funding saying the same thing?
- Is open interest growing, meaning positions are being added, or shrinking?
A high but flat reading with weak takers and neutral funding is background noise. A rising ratio with heavy taker buying and rising open interest is a different story.
What counts as crowding?
Crowding means one side is large enough, and committed enough, that it becomes a source of fuel for a sharp move against it. If price stalls, crowded traders are the ones who get squeezed out first. A crowded long is a candidate for a long flush; a crowded short is a candidate for a short squeeze.
A sensible test needs more than one input:
- Account ratio clearly skewed to one side,
- plus takers leaning the same way, or funding showing that side paying a cost.
That combination says "many traders, pushing, and paying to hold". The ratio alone says only "many traders".
The mirror case matters too. A ratio at or below 1, takers selling and funding negative together describe crowded shorts. Squeeze risk then runs the other way: a reclaim of a broken level can hurt the shorts, which is where a liquidity sweep can be a useful trigger.
What does it look like on real charts?
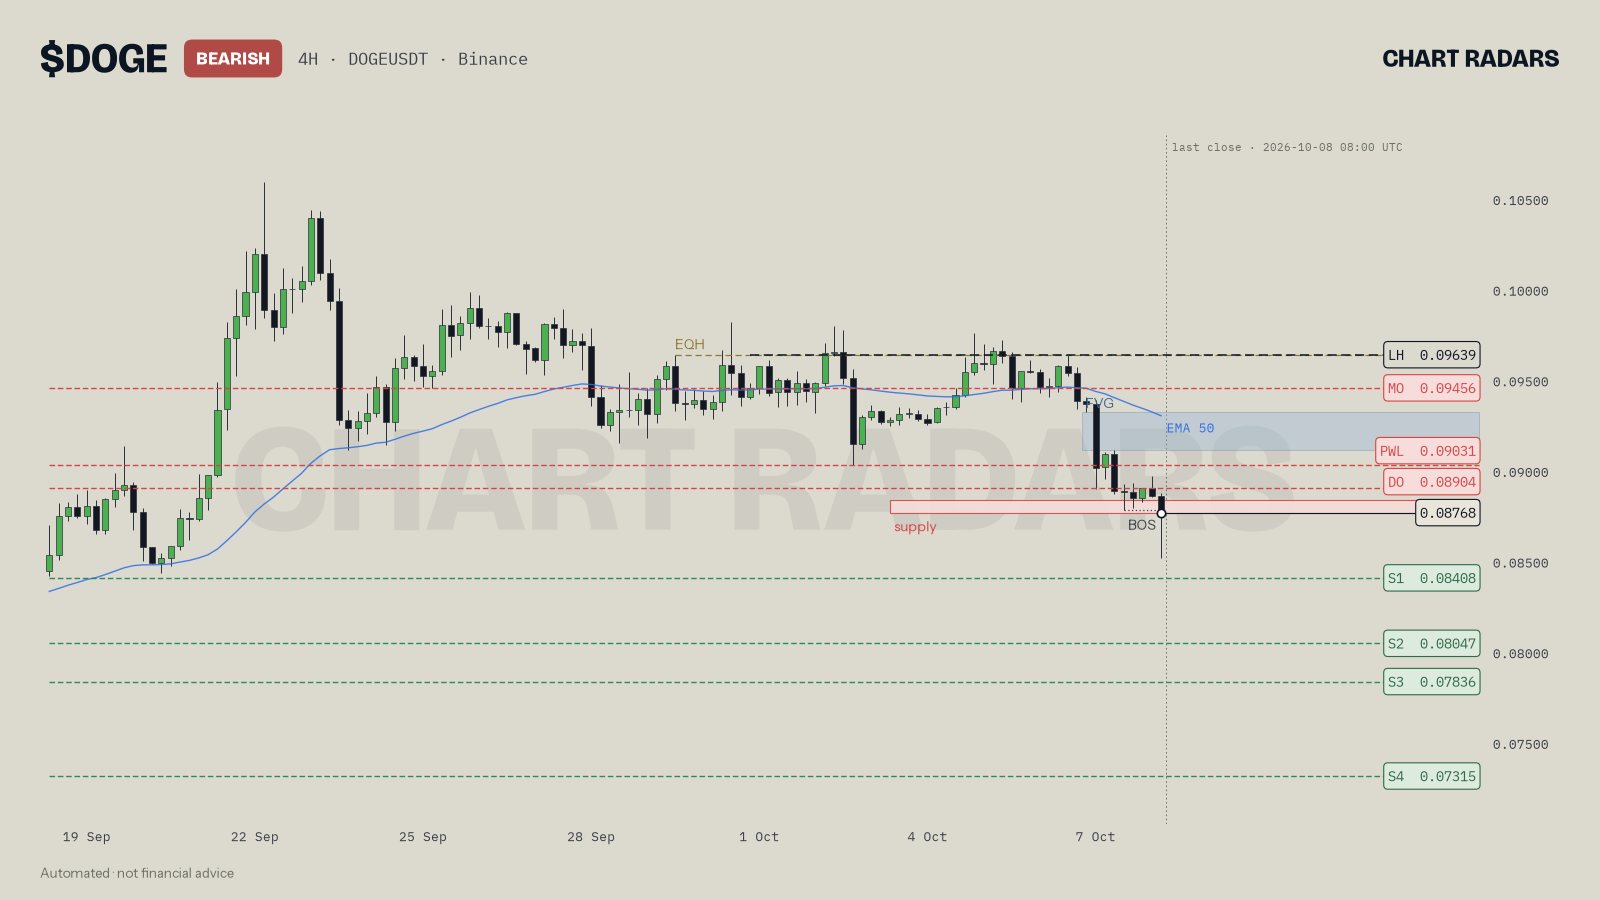
DOGE 4H, close of 8 Oct 2026. Structure is bearish on 4H, 1D and 1W, and price sits inside the 0.08765–0.08835 supply zone. The derivatives line shows funding +0.0004%, takers 0.86x and L/S 2.41. That ratio looks high, yet the read does not call longs crowded: funding is flat and takers are selling more than buying. This is the "above 2 is normal" case. The read's plan comes from structure, with invalidation above 0.09639.
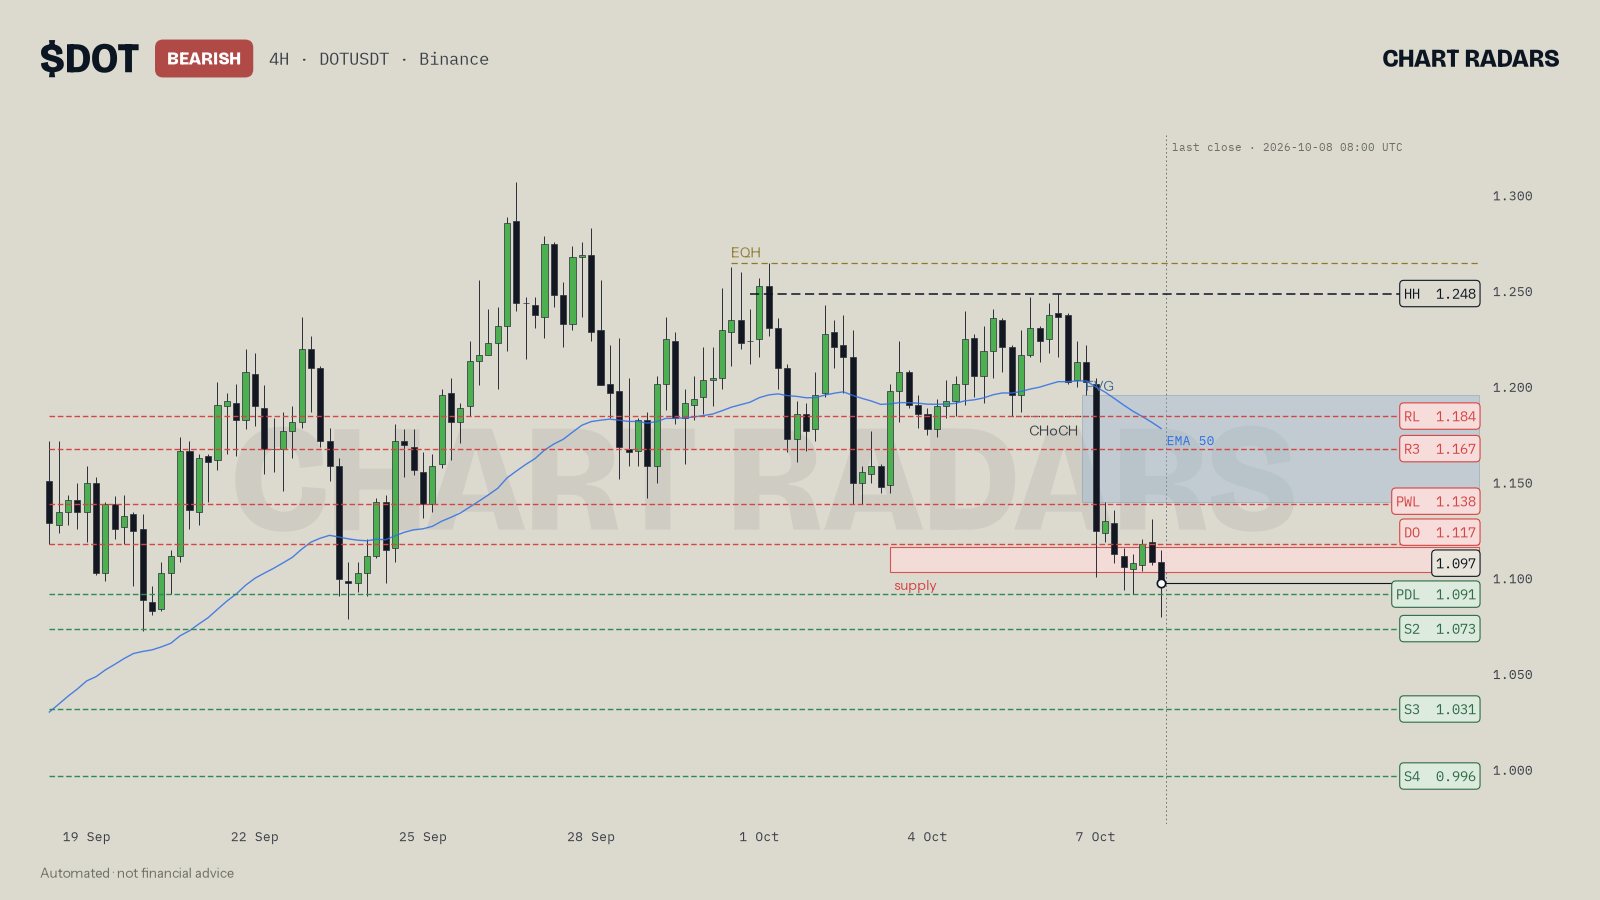
DOT 4H, close of 8 Oct 2026. Here the numbers are lower, L/S 1.64 and takers 0.98x, but funding is +0.0100%, and the read does state that longs look crowded in the flow data, leaving room for a flush toward 1.103. A lower ratio produced the flag and a higher one did not, because the other inputs differed. Even so, the crowding line is only one supporting note: the plan rests on bearish structure across three timeframes, a supply zone at 1.103–1.115 and invalidation above 1.248.
How do you use the long/short ratio in a plan?
Treat it as a modifier on an idea that structure already suggests:
- If structure is bearish, price rallies into a supply zone, and longs are crowded, then a rejection there has more fuel behind it. The idea is still wrong if price closes above the protecting high.
- If structure is bullish and the ratio has cooled while price holds a higher low, then the pullback is cleaner because fewer late longs remain to be shaken out.
- If shorts are crowded and price sweeps a low then closes back above it, then a squeeze is more plausible. The trigger is the reclaim, not the ratio.
- If the ratio is extreme but takers and funding are quiet, then treat it as noise and give structure the deciding vote.
For the bigger picture of how these ideas become conditional paths, see trading scenarios and invalidation.
When does the long/short ratio mislead you?
- As a contrarian trigger. "Everyone is long, so short it" has a poor habit of failing when a trend is strong and the crowd is simply right for a while.
- Across coins. Each coin has its own normal range, so a direct comparison between two tickers means little.
- Across data providers. Account-weighted, position-weighted and top-trader versions differ. Mixing them produces false conclusions.
- At single moments. The ratio updates in snapshots. A reading is a photograph, and it will not warn you the moment a trend turns.
- Without size. Account counts ignore how large each position is.
In Chart Radars: the derivatives line of each read shows funding, taker buy/sell and the long/short ratio. A crowded long needs L/S of at least 1.5 and either taker buy/sell of at least 1.2 or funding of at least 0.01%. A crowded short needs L/S at or below 1.0 and either takers at or below 0.85 or funding at or below -0.01%. For altcoins, an L/S above 2 on its own is treated as normal. These flags describe positioning, not direction.
Honest note: the long/short ratio is popular because it feels like a window into what "retail" is doing. It is a noisy, provider-dependent count, and crowded sides can stay crowded for weeks. Chart Radars uses it as one line of context next to structure, zones and invalidation, and in our own backtest even the trend label alone gave no strong directional edge, so a single positioning number should not be asked to carry a trade.
Key takeaways
- The long/short ratio counts positions that exist; the taker ratio shows aggressive orders that just happened. Read both.
- An L/S above 2 is ordinary on many altcoins, so judge it against that coin's own history.
- Crowding needs agreement: a skewed ratio plus taker flow or funding pointing the same way.
- Crowding supplies fuel for a flush or squeeze but never gives timing or direction by itself.
- Use it to filter a structure-based plan with a clear invalidation, never as the trade itself.
Frequently asked questions
What is the long/short ratio in crypto?
It compares how many accounts (or how much positioning) are long versus short on a futures market. A value of 2 means about two long accounts for every short one, depending on how the data provider counts.
Is a high long/short ratio bearish?
Not by itself. It says the crowd leans long, not that price must fall. It becomes more meaningful when taker buying is heavy or funding is elevated, and it still gives no timing.
What is a normal long/short ratio for altcoins?
Readings above 2 are common on altcoins because retail accounts lean long far more often than short. Compare a coin with its own recent history instead of with a fixed number.
What is the difference between the long/short ratio and the taker buy/sell ratio?
The long/short ratio is about positions that exist, counted by accounts. The taker ratio is about aggressive market orders in recent trading. One is a stock, the other is a flow, and they can disagree.
Can you trade the long/short ratio as a contrarian trigger?
It is risky. Crowded sides can stay crowded for a long time, and the data is noisy. Use it as context next to structure, funding and a clear invalidation level, not as a trigger.