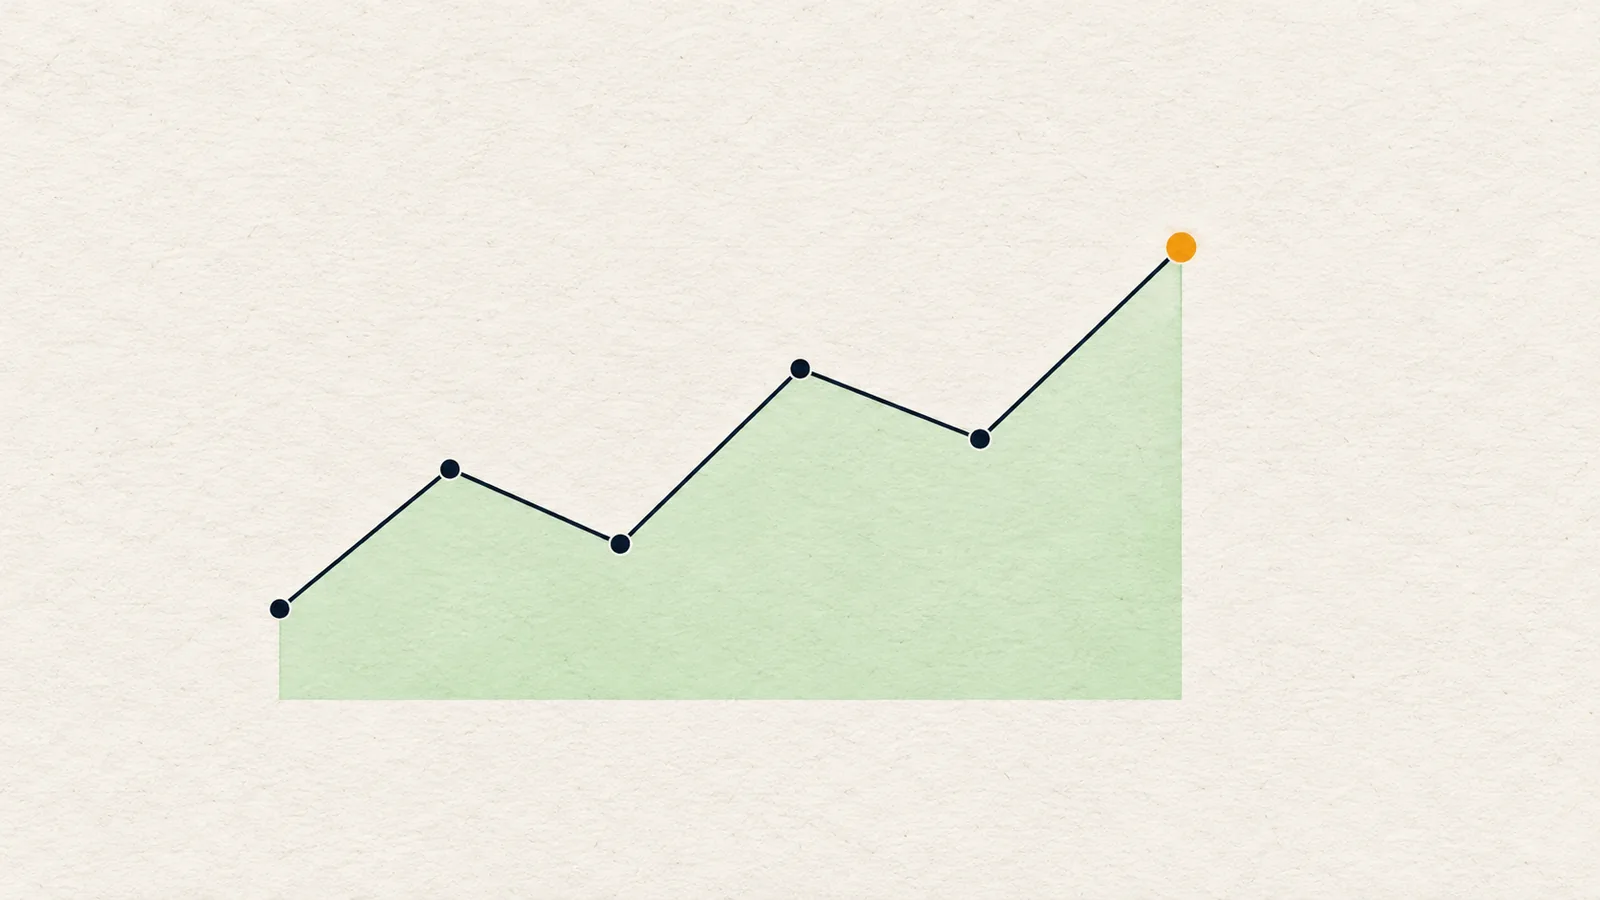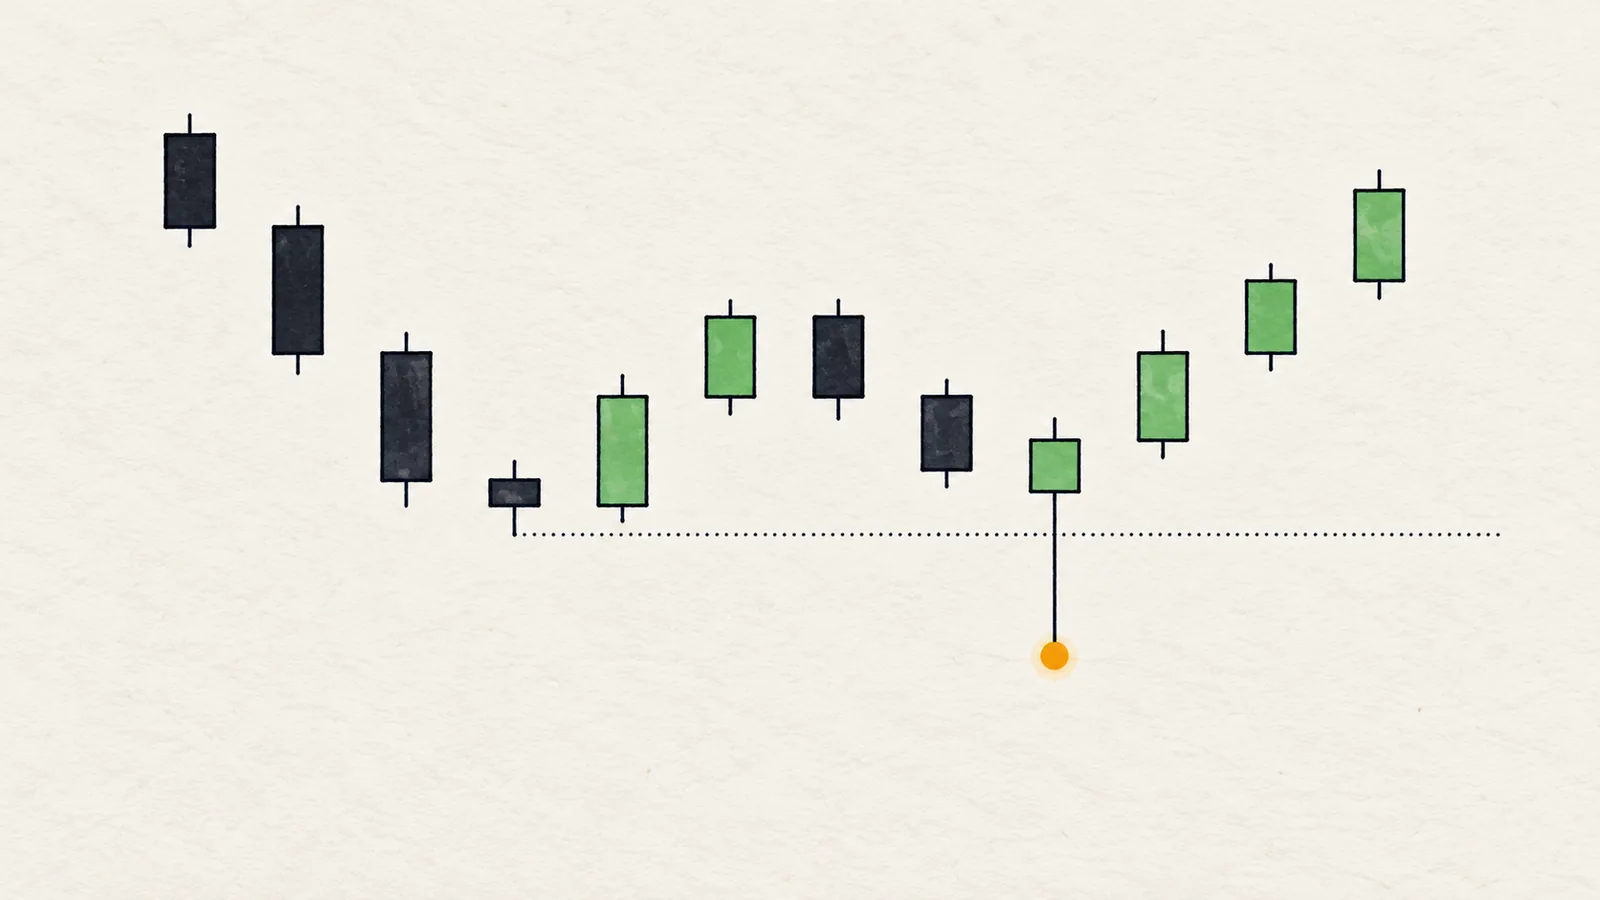
Open interest (OI) is the total number of futures contracts that are currently open: positions that have been opened and not yet closed or settled. It rises when new positions are created and falls when positions are closed. Unlike volume, which counts what traded, open interest counts what is still held.
What is open interest, and what is it not?
Every futures contract has two sides: a long and a short. When a new buyer and a new seller trade with each other, one new contract exists and open interest goes up by one. When two traders close existing positions against each other, a contract disappears and it goes down by one. When one trader closes and another opens in their place, nothing changes.
So open interest tells you how much exposure exists in the market right now. It is not:
- Volume. Volume counts every trade, including trades that only transfer an existing position. OI can stay flat on a day with huge volume.
- A long/short ratio. The two sides of every contract are always equal in size. OI cannot be "mostly long". Long/short ratios come from other data about accounts or positioning.
- A direction. It says a position exists, not whether the holder is right.
One more caution: OI is quoted either in contracts (or coins) or in dollars. If it is quoted in dollars, a rising price lifts the figure even with no new positions. Check which one a chart or a number is using before drawing conclusions.
Why do traders watch it alongside price?
Price shows what happened. Open interest hints at who is putting money to work behind it. A move with expanding open interest has fresh participation. A move with shrinking open interest is mostly existing positions being closed. Those two are different environments even when the candle looks the same.
How do you read price and open interest together?
The four combinations are usually summarised as a matrix:
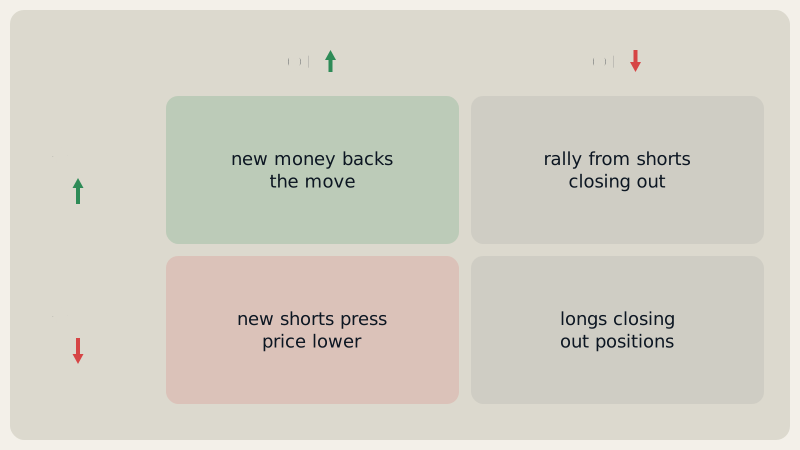
- Price up, OI up. New positions are entering as price rises. The move has participation and, usually, more leverage building behind it. This can support a trend, and it can also mean a crowd is forming: check funding.
- Price up, OI down. The rally is happening while positions are being closed, often shorts buying back to exit. Nobody new is adding. This kind of rally has a thinner base and is a candidate to fade when it runs into resistance.
- Price down, OI up. New positions are opening into the drop. They could be new shorts, or dip-buyers averaging in; the data does not say. Either way fuel is building for a continuation or for a violent reversal.
- Price down, OI down. Positions are closing as price falls: forced liquidations, traders cutting risk, or both. When open interest falls sharply during a sharp drop, some of the leverage has already been flushed, which is often a necessary part of stabilising.
These are readings, not rules. The matrix tells you what kind of move you are looking at, not what comes next.
Rising OI on a breakout vs falling OI on a rally
This is the single most useful application.
Breakout with rising OI. Price closes above a level and open interest rises at the same time. New participants are entering. If funding stays near its baseline, that is healthier than a breakout where funding climbs fast, because the crowd is not obviously piling onto one side. The breakout has fuel and a clear invalidation: a close back below the broken level.
Rally with falling OI. Price rises and open interest falls. The move is not being fed by new positions; it is positions closing. That suggests the push can fade once the closing is done. It is not a reason to short blindly. It is a reason to be careful about chasing the move and to wait for structure to confirm.
The mirror applies to drops: a fall with rising OI has new money behind it; a fall with falling OI is liquidations and exits, which tend to exhaust.
How do open interest and funding combine?
Open interest tells you how many positions exist. Funding tells you who is paying to hold them. Together:
- OI up, funding high positive. Many new longs and they pay for it: a crowded long is building. A pullback or a liquidity sweep can hurt it quickly.
- OI up, funding near baseline. Participation without obvious crowding. A cleaner backdrop for a trend.
- OI up, funding negative. Shorts are paying to hold; they are crowded. A reclaim of a level can force them out.
- OI down, funding returning to baseline. The market is resetting. A trend that restarts from here is starting from a cleaner position.
Why can't you know who opened the positions?
Because every contract has both a long and a short, a rise in OI is always a new long and a new short. Nothing in the OI number says which of them was the more eager party. Some clues exist: aggressive buying or selling in taker flow, the sign of funding, price reaction. They are indirect and noisy.
Some OI is also not a view at all. Traders who hold spot and short futures against it, for example, create open interest without a bet on direction. So "OI rose, therefore speculators are bullish" is a leap.
Honest reading is "participation increased", never "bulls took control".
What does it look like on real charts?
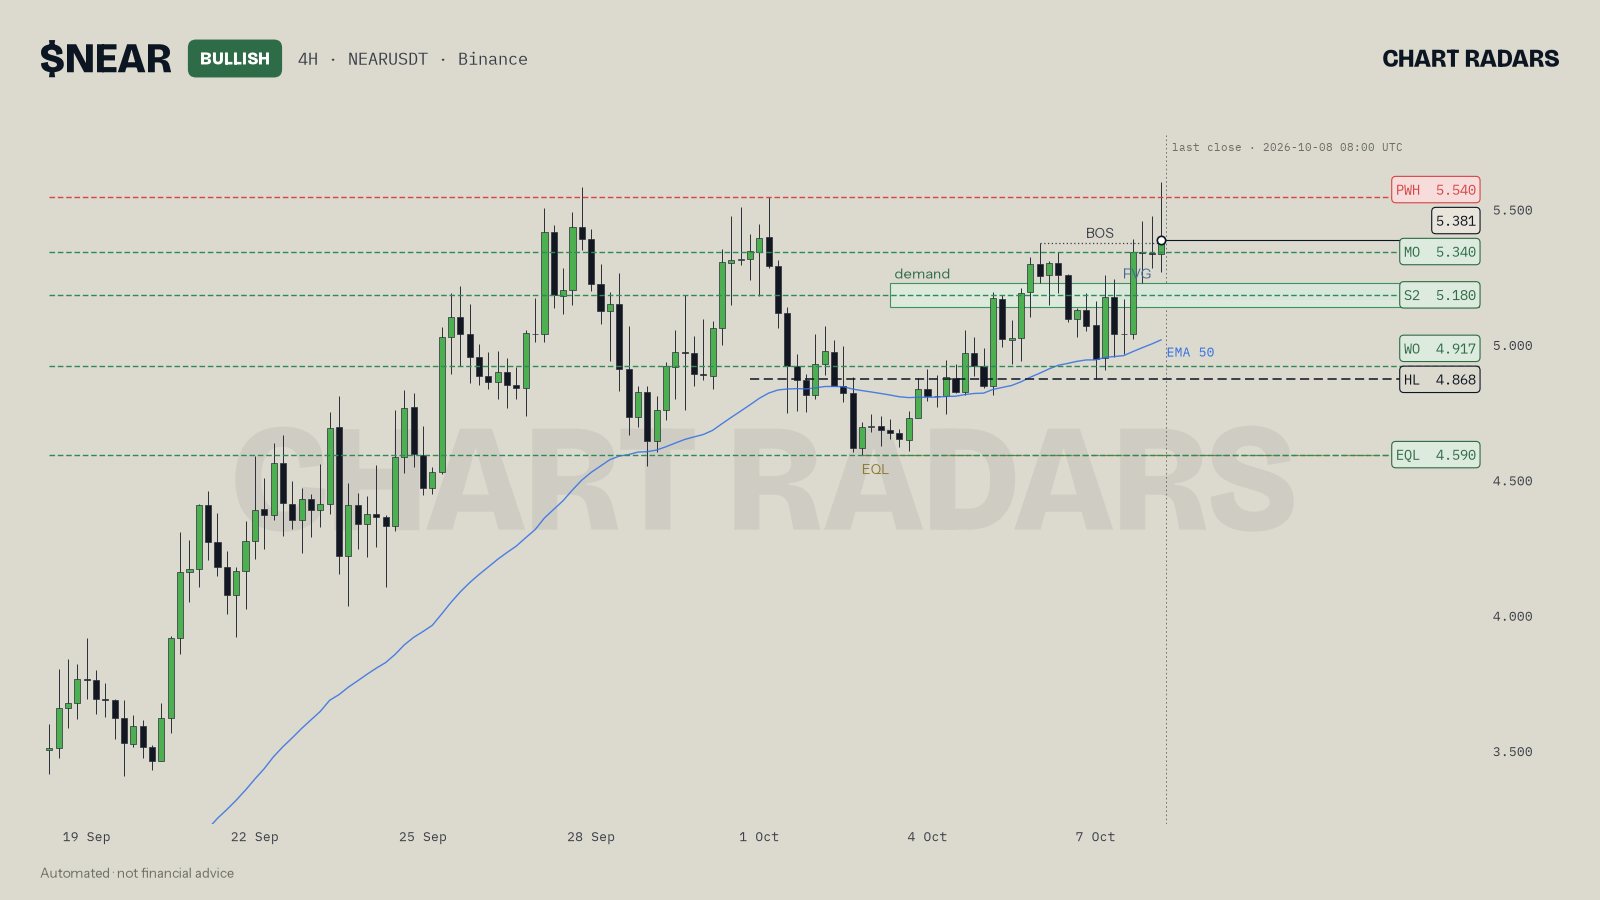
NEAR 4H, 8 Oct 2026. Structure is bullish on 4H, 1D and 1W, and the chart shows a BOS up with the last close at 5.381, just over the 5.37 level that was broken. The last candle's wick reaches above the 5.540 prior-week high, though the close is below it. The flow line of the read says futures open interest is $299.4M, up 7.6% on the day, so participation is building, with funding +0.0003% and long/short at 1.40. That is the first matrix cell: a move up, more positions opening, and funding near baseline rather than climbing. The plan is still conditional: a pullback into 5.135–5.225 is preferred, and a 4H close under 4.868 voids the read.
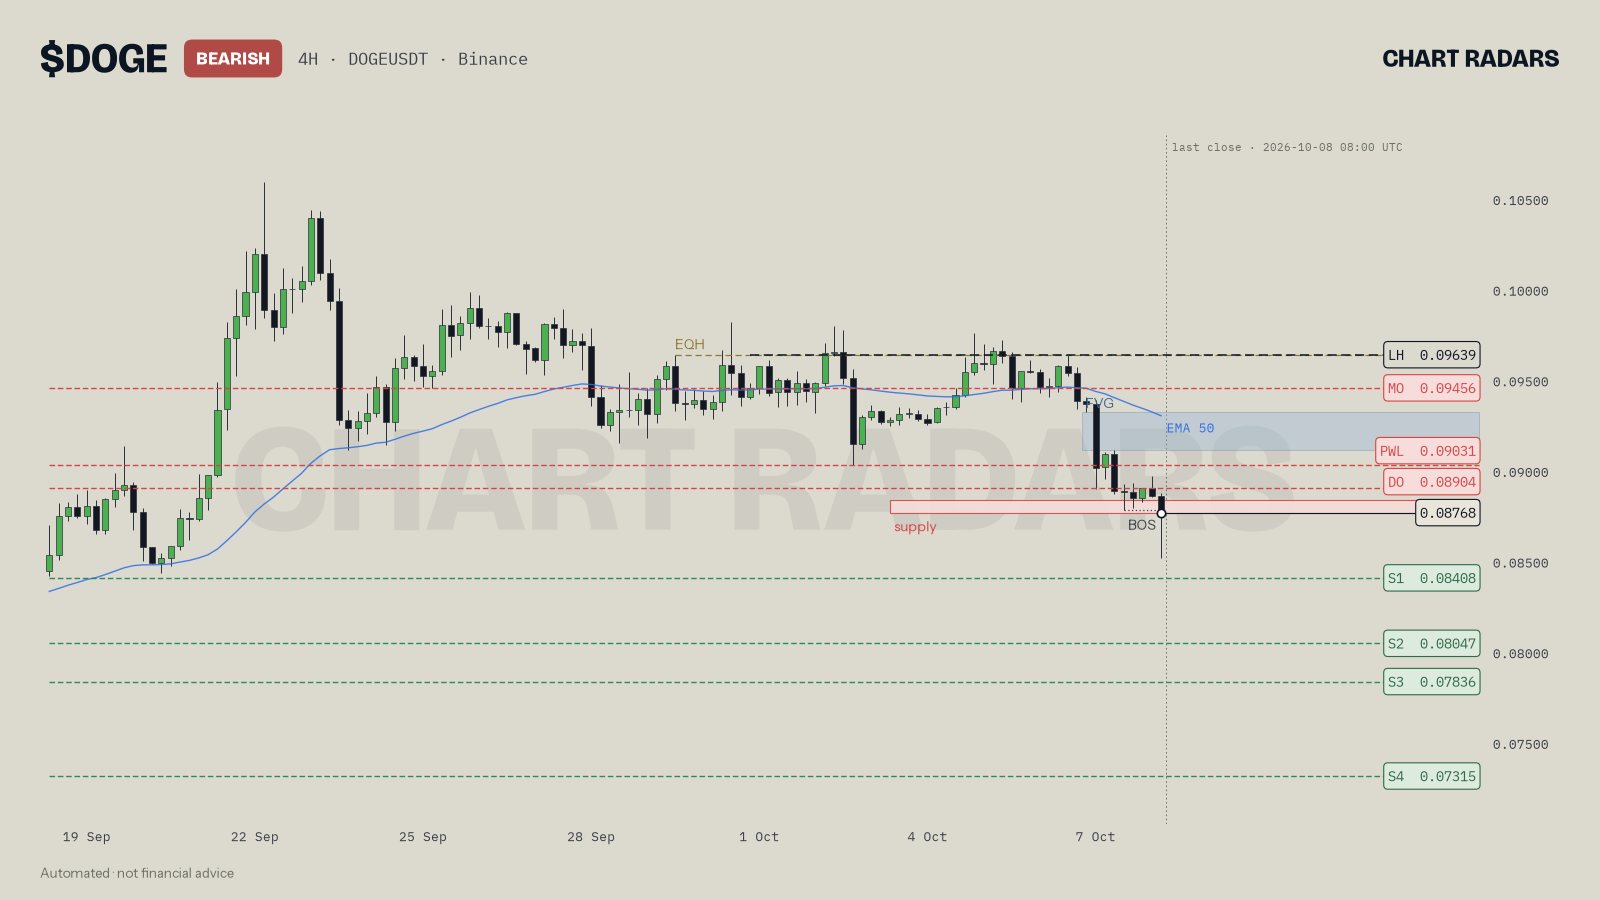
DOGE 4H, 8 Oct 2026. Here the picture is the opposite. Structure is bearish on 4H, 1D and 1W, the chart shows a BOS down, and price at 0.08768 is trading inside the 0.08765–0.08835 supply zone. The read says open interest has shrunk to $235.9M, down 15.7% over 24h, which it interprets as traders taking risk off, with funding +0.0004%. A fall with falling open interest means positions are closing, not new ones piling in. That does not say the drop is over: the read still expects the next leg to run through 0.08408 once a bounce fails, and it only voids on a 4H close above 0.09639. It tells you what kind of move this is.
When does open interest mislead you?
- Dollar vs coin units. A rising price inflates OI quoted in dollars even if no one opened anything new.
- Different exchanges. OI on one venue is not the whole market.
- Hedged positions. Some OI is a hedge, not a directional bet.
- Short windows. One candle's change is noise. Compare over a meaningful window, such as a day.
- Calling a direction from one cell. OI up with price down is not "the shorts are right".
- Lag in your own reading. By the time you see OI rise, part of the move has happened.
In Chart Radars: the engine reads the change in Binance futures open interest over the window of the read. A change above 1% is "positions are opening" and a change below -1% is "positions are closing"; anything in between is "stable". It does not try to guess who opened those positions. Funding, taker buy/sell and the long/short ratio are shown next to it, and a crowded side is only flagged when the long/short ratio is at 1.5 or more and either taker buy/sell is at 1.2 or more or funding is at 0.01% or more.
Honest note: open interest looks like hidden information, which makes it easy to over-read. It does not show who is winning, who is smart, or what comes next, and a change in OI can be driven by hedging, by dollar valuation or by one large trader. Chart Radars treats it as context for how much participation a move has, which is why its reads are described as maps of conditions rather than predictions.
How do you plan with open interest (if/then)?
- If price closes above resistance on 4H and OI rises with funding near baseline, then the breakout has participation. Plan around a hold or a retest of the broken level; invalidation is a close back below it.
- If price breaks out but OI falls, then treat the move with suspicion and wait for a retest that holds.
- If price sweeps a low, OI drops sharply, and price reclaims the level, then forced exits have likely been flushed; the reclaim is your trigger, not the OI.
- If OI keeps rising, funding climbs and price stalls under resistance, then a crowd is building into a ceiling; reduce size or wait for structure to break.
- If price falls with falling OI into a demand zone, then exhaustion becomes more plausible; still wait for a structure shift before acting.
Key takeaways
- Open interest is the number of futures contracts still open; it rises when positions are created and falls when they close.
- It is not volume and it cannot be "mostly long": every contract has equal long and short sides.
- The price and OI matrix describes the kind of move: new participation, short covering, new pressure into a drop, or exits.
- Rising OI on a breakout means participation; falling OI on a rally means the push is mostly closing positions.
- You cannot know who opened the positions; use funding and taker flow as clues and plan with if/then conditions.
Frequently asked questions
What is open interest in crypto?
It is the total number of futures contracts that are open and not yet closed or settled. It rises when new positions are created and falls when positions are closed.
Is rising open interest bullish?
Not by itself. Rising open interest means more positions are open. If price is rising, that is participation behind the move, but the new positions could be longs, shorts or hedges.
What is the difference between open interest and volume?
Volume counts how much traded during a period. Open interest counts how many contracts remain open at a moment. A trade can add volume without changing open interest.
Does falling open interest mean liquidations?
It means positions are being closed. Closing can be forced liquidations or traders choosing to exit, and open interest alone cannot tell you which.
Can you tell if longs or shorts opened the new positions?
No. Every open contract has a long side and a short side in equal amount, so open interest rising does not say who is more aggressive. Taker flow and funding add clues, not proof.