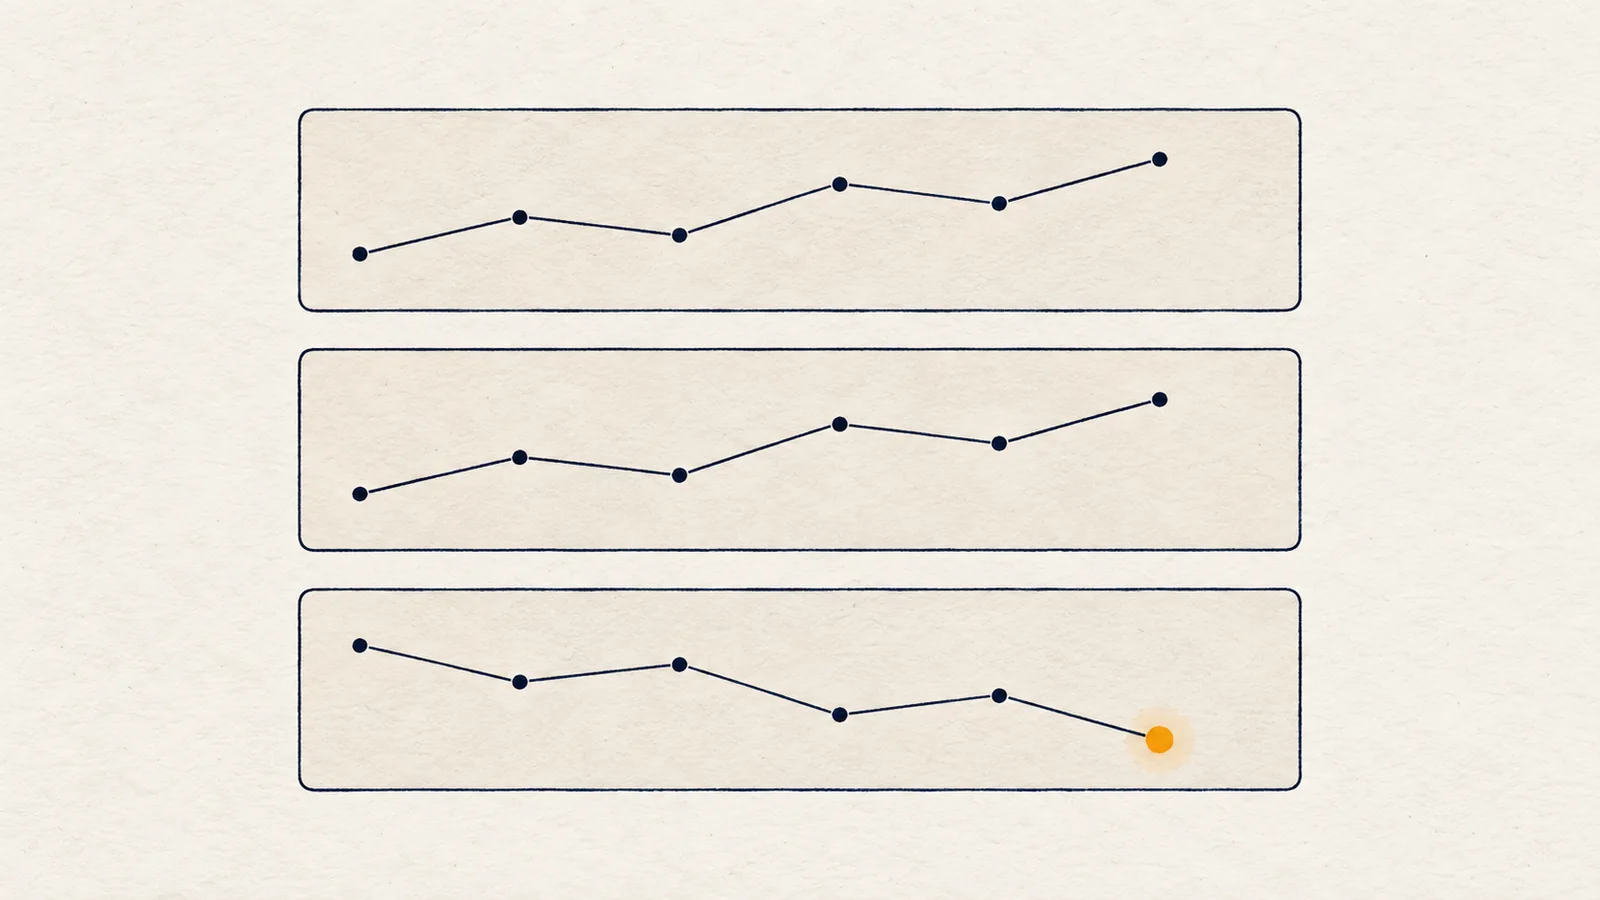
Relative strength compares how a coin performs against a benchmark, which in crypto is usually Bitcoin. A coin is relatively strong if it gains more, or falls less, than Bitcoin over the same period, and relatively weak if the opposite is true. It says who is leading, not where price will go next.
Why do altcoins move with Bitcoin?
Bitcoin is the deepest market in crypto. Most altcoin pairs are priced against a dollar stablecoin, but their buyers and sellers are reacting to the same macro news, risk appetite and flows that move Bitcoin first. Many traders also treat Bitcoin as the market's temperature: when it is falling hard, they cut risk everywhere, including in coins that had no news of their own.
Two practical consequences follow:
- A coin's chart is partly Bitcoin's chart. A clean bullish setup on an altcoin can be damaged by a sharp Bitcoin sell-off that has nothing to do with the coin.
- Beta varies. Many altcoins amplify Bitcoin's moves, rising faster in good times and falling faster in bad ones. How much differs from coin to coin.
That second point is why "the coin went up" is not enough information. If Bitcoin went up more, the coin actually lost ground.
What is the coin/BTC ratio?
The coin/BTC ratio is the coin's price divided by Bitcoin's price. It is the price of the coin measured in bitcoin instead of dollars.
A made-up example with round numbers: say a coin trades at 10 when Bitcoin trades at 100000, so the ratio is 0.0001. If the coin rises to 11 and Bitcoin rises to 120000, the dollar price is up 10% but the ratio is now about 0.0000917. The coin made money in dollars and still lost to Bitcoin.
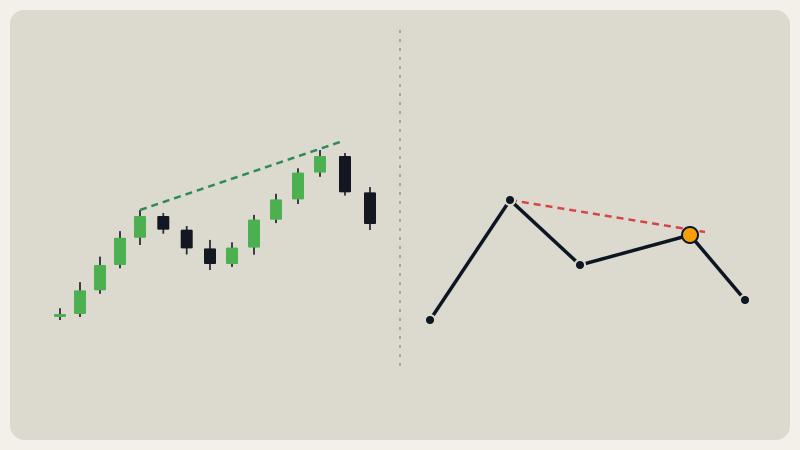
A rising ratio means the coin is outperforming. A falling ratio means it is underperforming. You can view the ratio as a chart of its own and treat it like any other: it has highs, lows, trend and levels.
What do "lagging highs" and "holding lows" mean?
Two patterns are more informative than a raw percentage because they compare turning points:
- Highs lag BTC. The coin's dollar chart prints a new high, but the coin/BTC ratio does not. Money pushed the coin higher, but not by more than Bitcoin. This can show a thin or tired advance, and it is the relative-strength cousin of a divergence.
- Lows held versus BTC. The coin's dollar chart prints a new low, but the ratio does not. The coin fell, but less than Bitcoin. This can show that sellers are losing interest in that coin specifically.
Neither pattern is a reversal call. They are small pieces of evidence that sit next to structure.
There is also the simple performance gap: over the last 24 hours, how much did the coin beat or trail Bitcoin? A gap of a couple of percent either way separates a coin that is moving with the market from one that is moving on its own.
What does it look like on real charts?
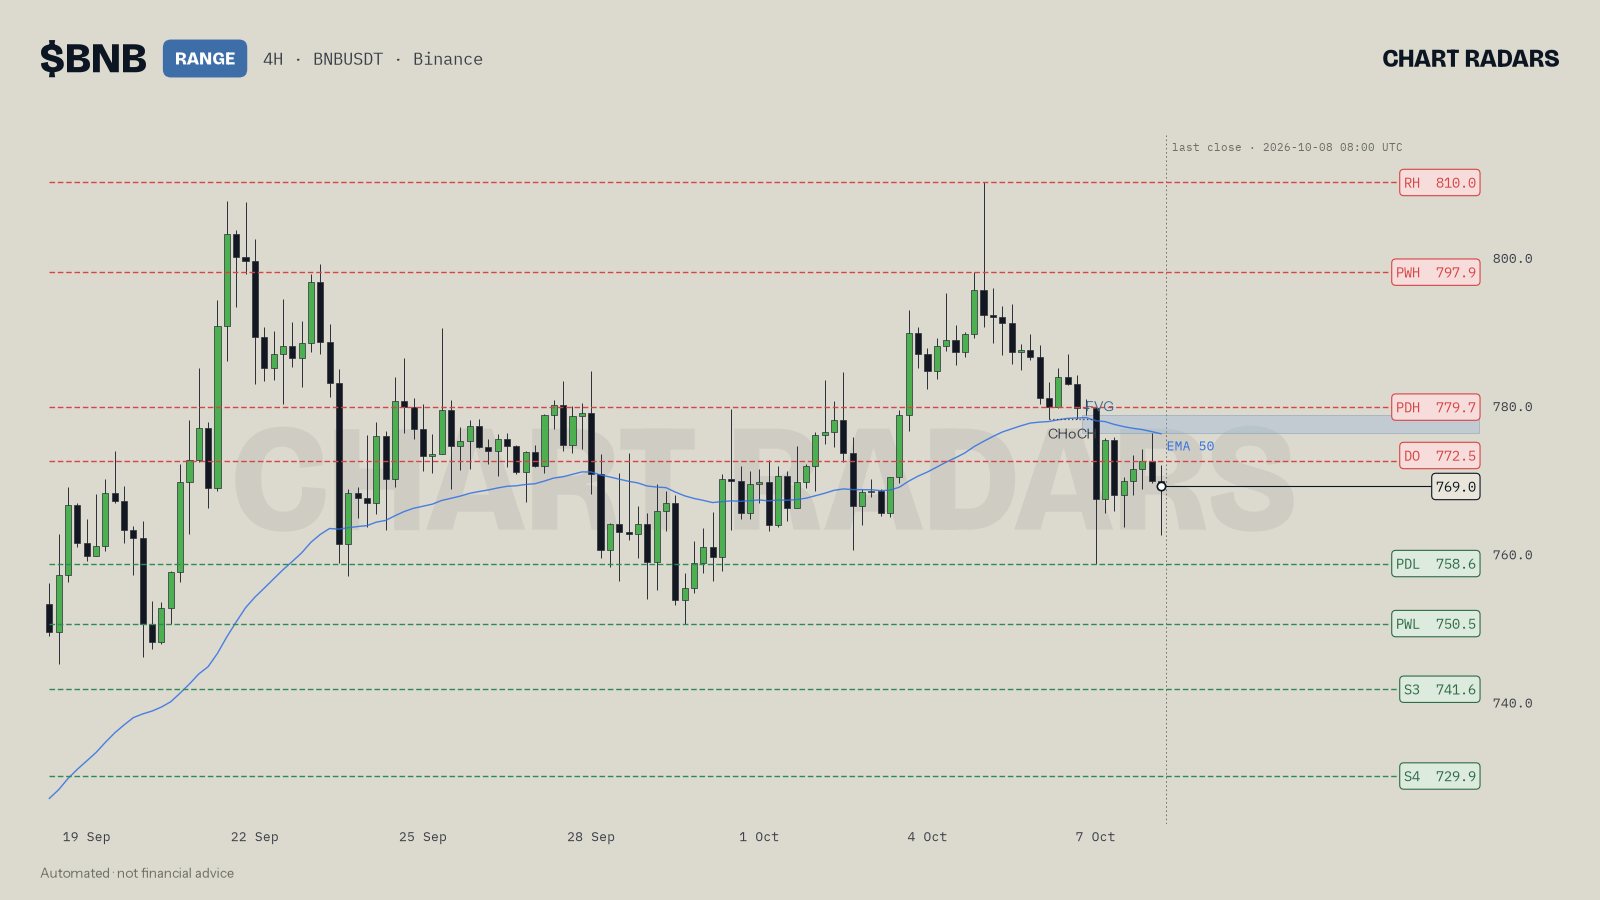
BNB 4H, close of 8 Oct 2026. The chart is labeled range and the read finds no edge: 4H bearish, 1D and 1W bullish. The relative-strength line says BNB made a higher high on 4H while BNB/BTC failed to follow, so it is lagging its benchmark at the highs. The read treats that as a reason not to lean on either side, and it waits for the edges of the 758.6–810.0 range.
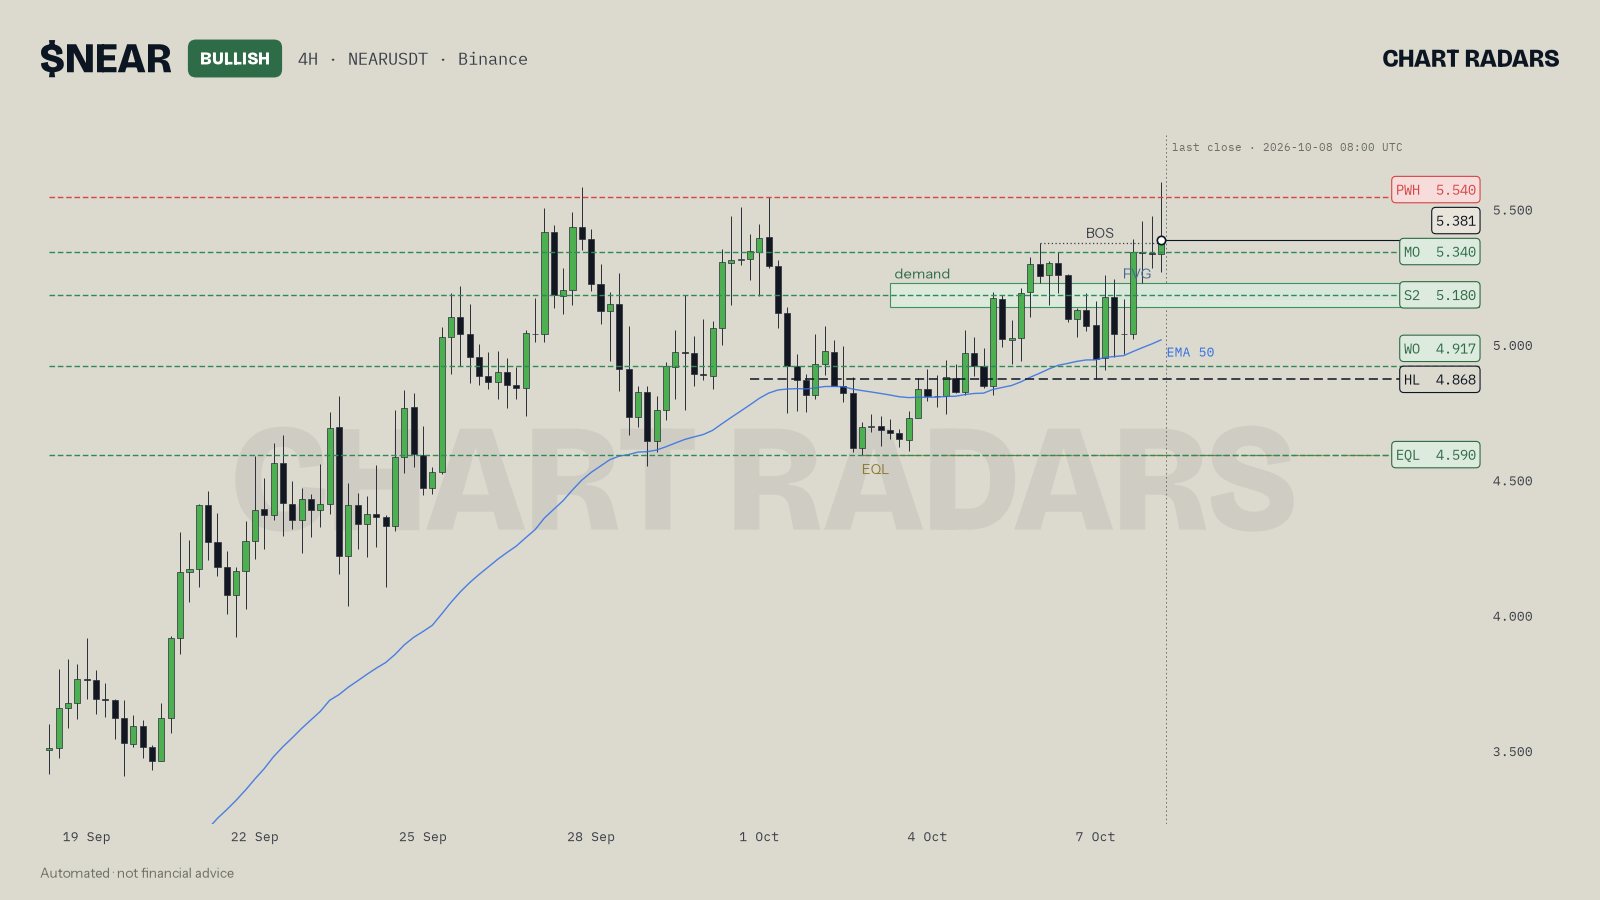
NEAR 4H, close of 8 Oct 2026. The read is bullish with 4H, 1D and 1W aligned, and it says NEAR outperformed BTC by 5.4% over the last 24 hours. It counts that in favour of the idea, next to price holding above the weekly open at 4.917. The plan still depends on structure: a pullback into 5.135–5.225, a 4H close above 5.540 as the level to beat, and invalidation below 4.868.
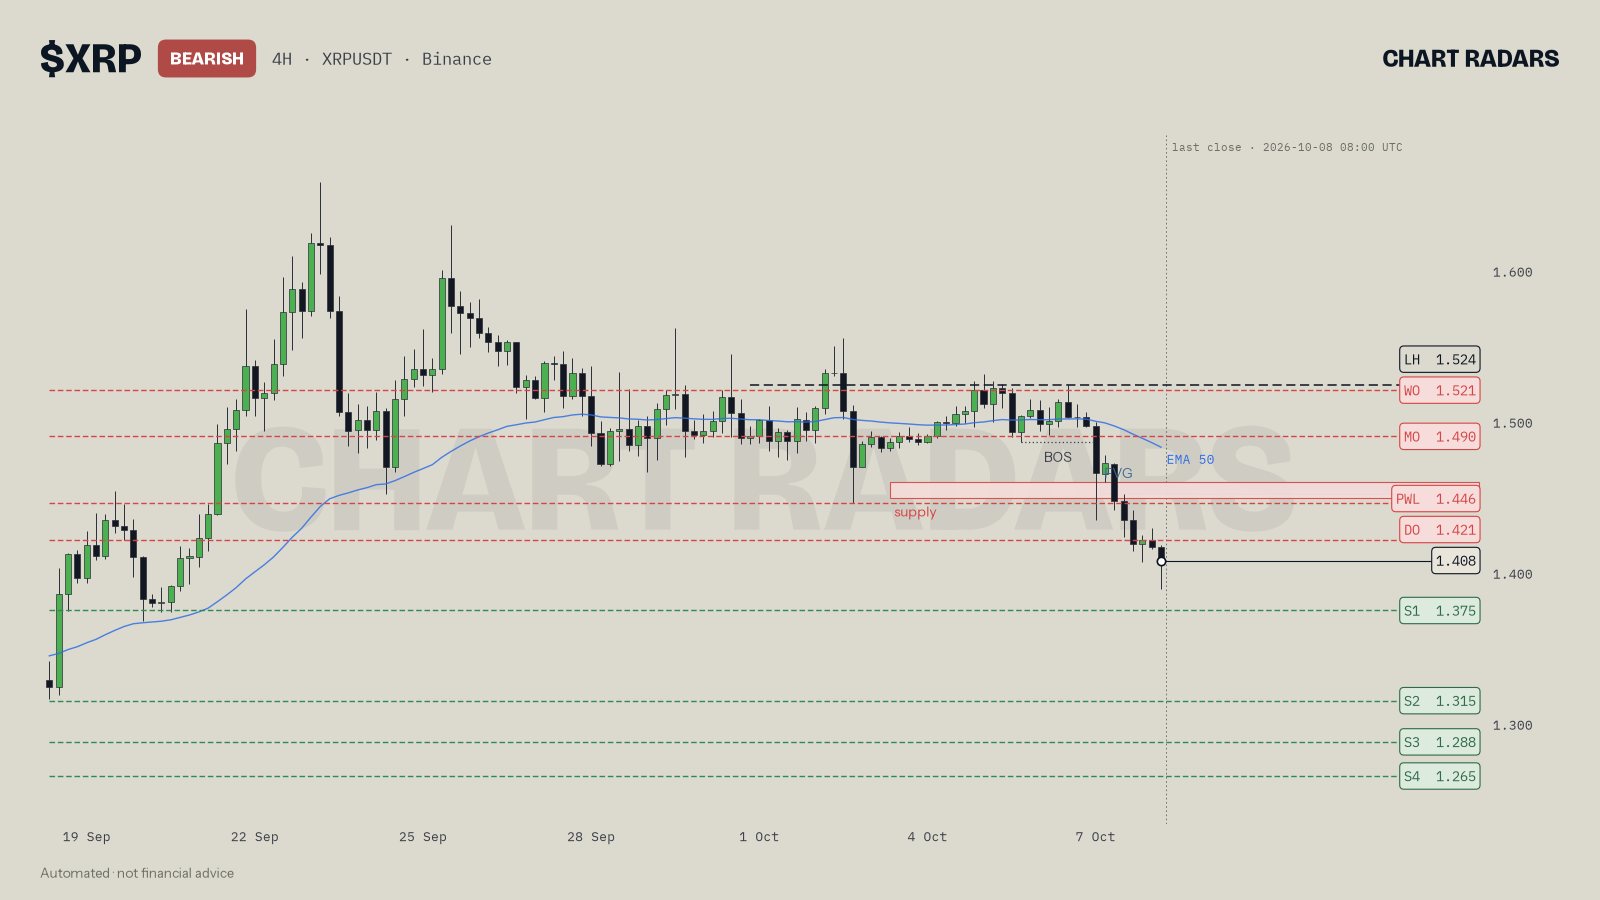
XRP 4H, close of 8 Oct 2026. The read is bearish and notes XRP running 3.0% weaker than BTC on the day, again as supporting context. Its plan: wait for a rally into 1.449–1.460, with invalidation above 1.524. Weakness versus BTC lined up with the structural picture here; it did not create it.
How do you use relative strength in a plan?
Use it to rank and filter ideas that structure has already produced, with if/then statements:
- If structure is bullish and the coin is also outperforming BTC, then the idea has both internal and market support. The plan still needs a trigger and an invalidation.
- If structure is bearish and the coin is weaker than BTC, then a rally into supply is more likely to meet sellers. A close above the protecting high still cancels it.
- If a coin makes a new high with the BTC pair lagging, then be slower to chase that breakout and wait for a close and a retest, as covered in the guide to liquidity sweeps.
- If Bitcoin itself is at a decision level, then weigh the coin's own chart less. Bitcoin's multi-timeframe picture can dominate.
A good habit is to look at Bitcoin's chart first, then the coin's, then the ratio. Ask three questions in that order: is Bitcoin trending or stuck at a level, does the coin's own structure agree with the idea, and is the coin keeping pace with Bitcoin or not? If the answers conflict, the plan gets smaller or the answer becomes "wait". For how the coin's own structure is read, see market structure.
When does relative strength mislead you?
- Using it as an entry trigger. Strength is a description of the recent past, not a forecast.
- Short windows. A 24-hour gap can come from one fast hour. Check whether the gap persists across timeframes.
- Illiquid coins. A small coin can outperform because of a thin market, not because of demand.
- Ignoring the cause. A coin with its own news or listing can decouple from Bitcoin for good reasons, and past correlation stops helping.
- Strength in a falling market. "Falling less than Bitcoin" is still falling. The coin's own structure still decides what a plan looks like.
In Chart Radars: on the 4H chart the engine compares the coin/BTC ratio. If the coin makes a new high but the ratio does not (with a 0.2% tolerance), the read says the coin is lagging BTC at the highs. If the coin makes a new low but the ratio does not, it says the coin is holding its lows against BTC. Otherwise, a 24-hour performance gap of 2% or more is called clearly stronger or weaker. The line is context; it never sets a trigger or an invalidation.
Honest note: relative strength is easy to oversell. "Buy the strongest coin, avoid the weakest" sounds sensible, but leadership rotates and can disappear quickly. Chart Radars shows it as one supporting line, and our own backtest found that even the trend label alone gave no strong directional edge, so a performance gap should not be asked to carry a trade.
Key takeaways
- Relative strength compares a coin with Bitcoin; the coin/BTC ratio is that comparison drawn as a chart.
- A coin can gain in dollars and still lose against Bitcoin, so check the ratio.
- Highs that lag BTC and lows that hold against BTC are better evidence than a single percentage gap.
- Use it as context that supports or weakens a structure-based plan, never as a trigger.
- Keep the plan conditional, with a clear scenario and invalidation, whatever the ratio says.
Frequently asked questions
Why do altcoins follow Bitcoin?
Bitcoin is the main source of liquidity and the reference price in crypto, and many altcoins trade against it or are held with it. When Bitcoin moves sharply, most altcoins tend to move the same way, often by more.
What does the coin/BTC ratio show?
It divides a coin's price by Bitcoin's price. If the ratio rises, the coin is gaining against Bitcoin even if its dollar price is flat. If it falls, the coin is losing ground in BTC terms.
What does it mean when an altcoin makes a new high but the BTC pair does not?
The coin rose in dollars, but not faster than Bitcoin. It is called lagging at the highs, and it can be a sign that the move is thin. It does not mean price must turn down.
Is a strong altcoin versus Bitcoin a buy?
No. Relative strength describes recent performance, not what comes next. Use it as context beside structure, levels and an invalidation level, never as the reason to enter alone.
How is relative strength different from correlation?
Correlation says how closely two assets move together. Relative strength says which one is doing better. Two coins can be tightly correlated and still show a steady performance gap.