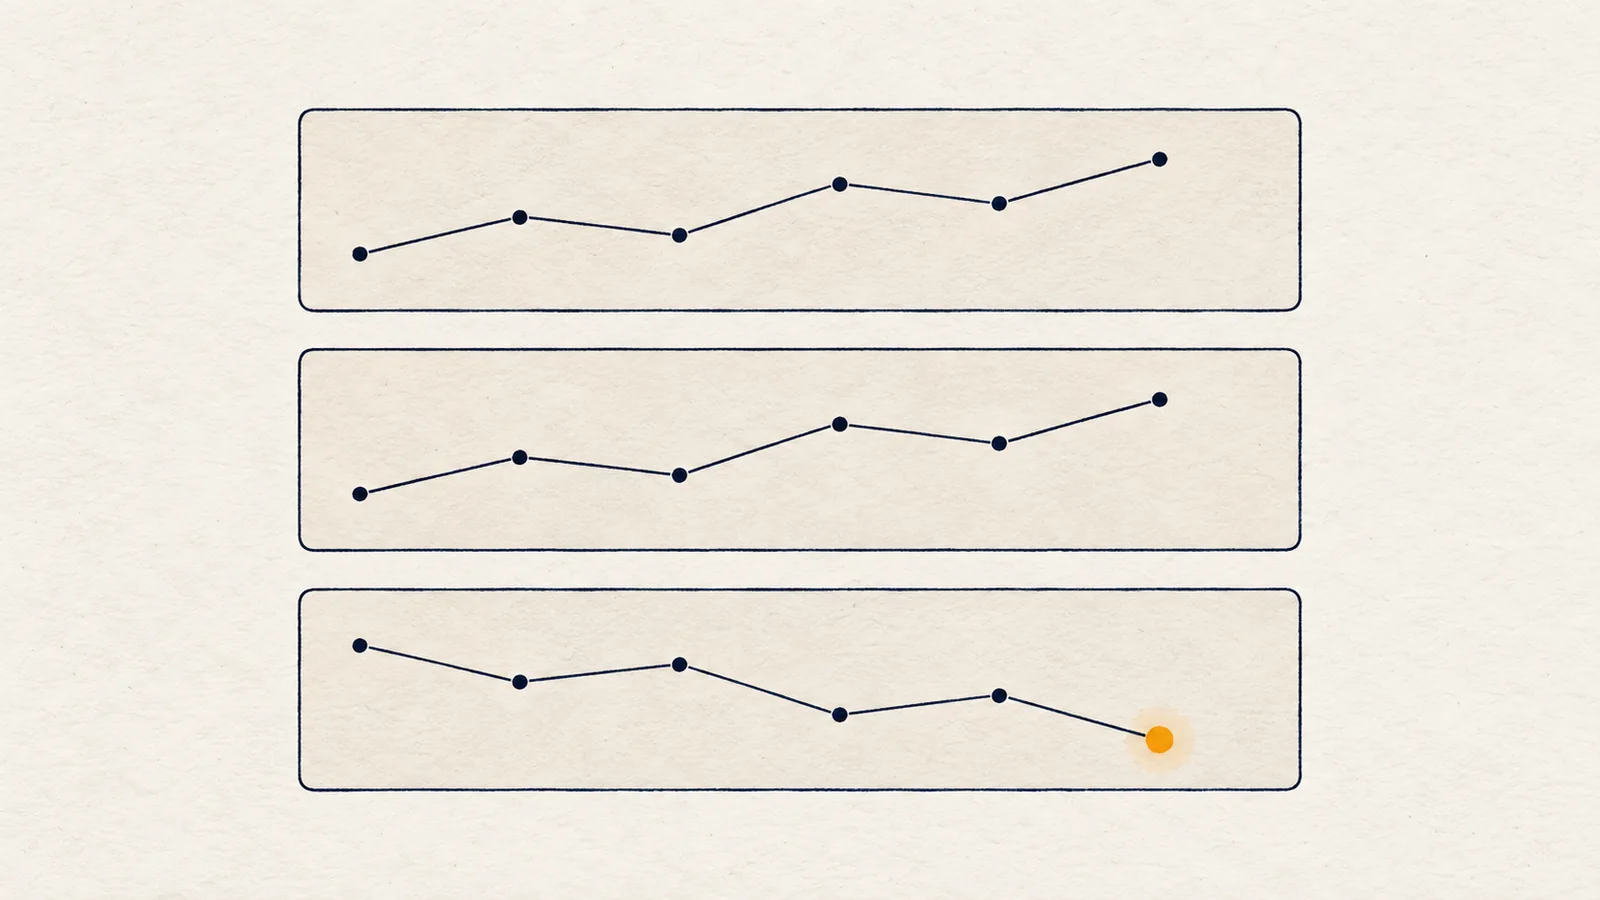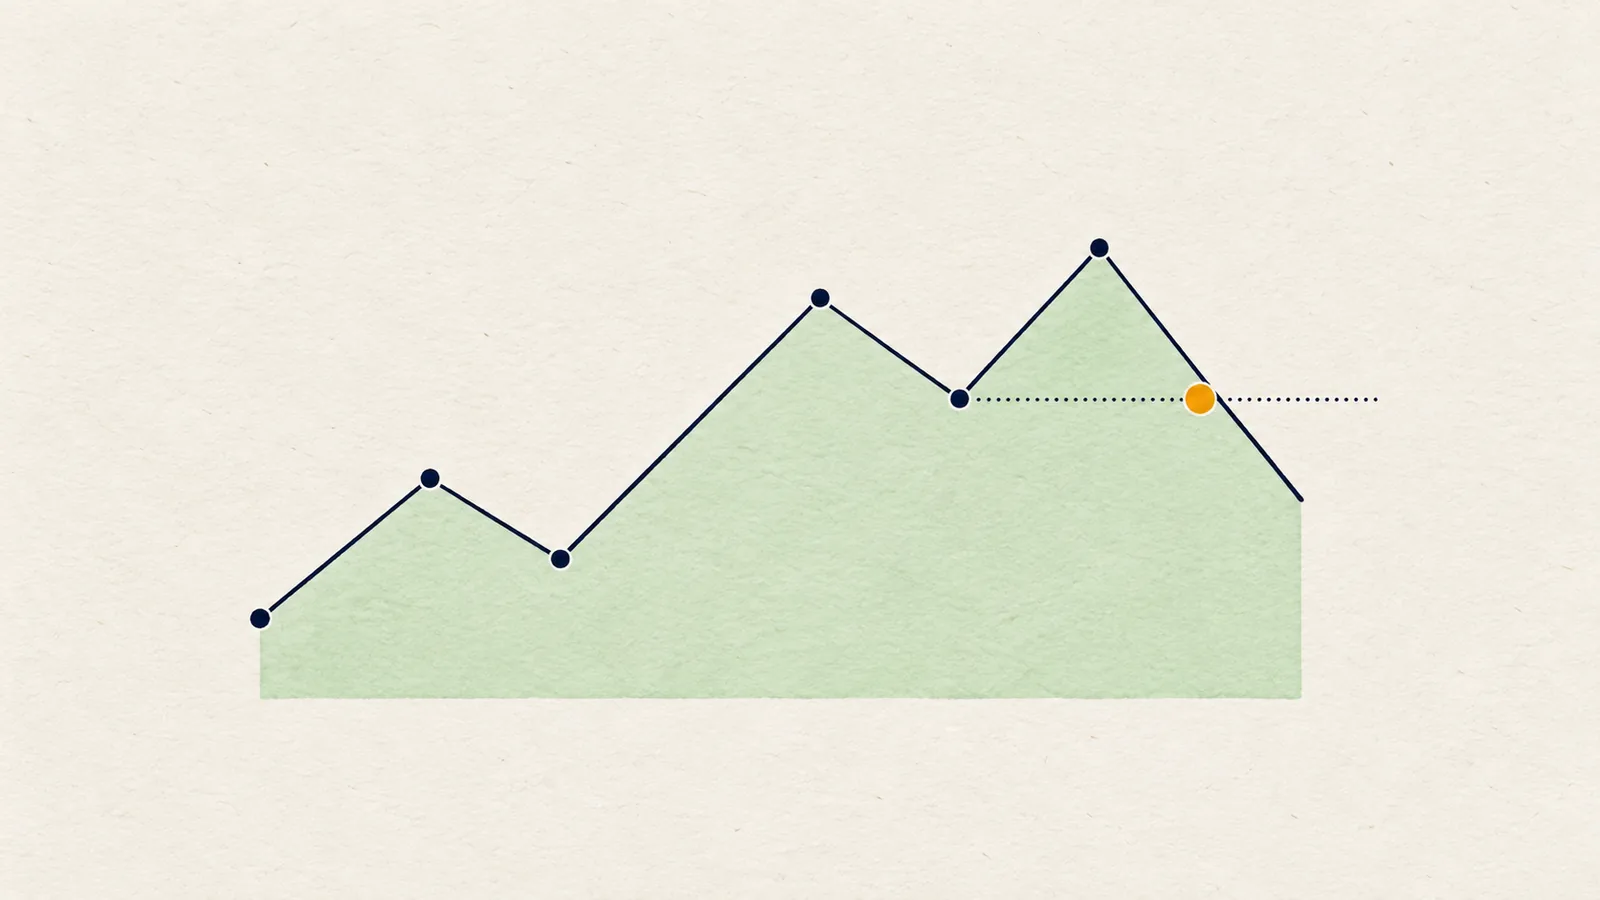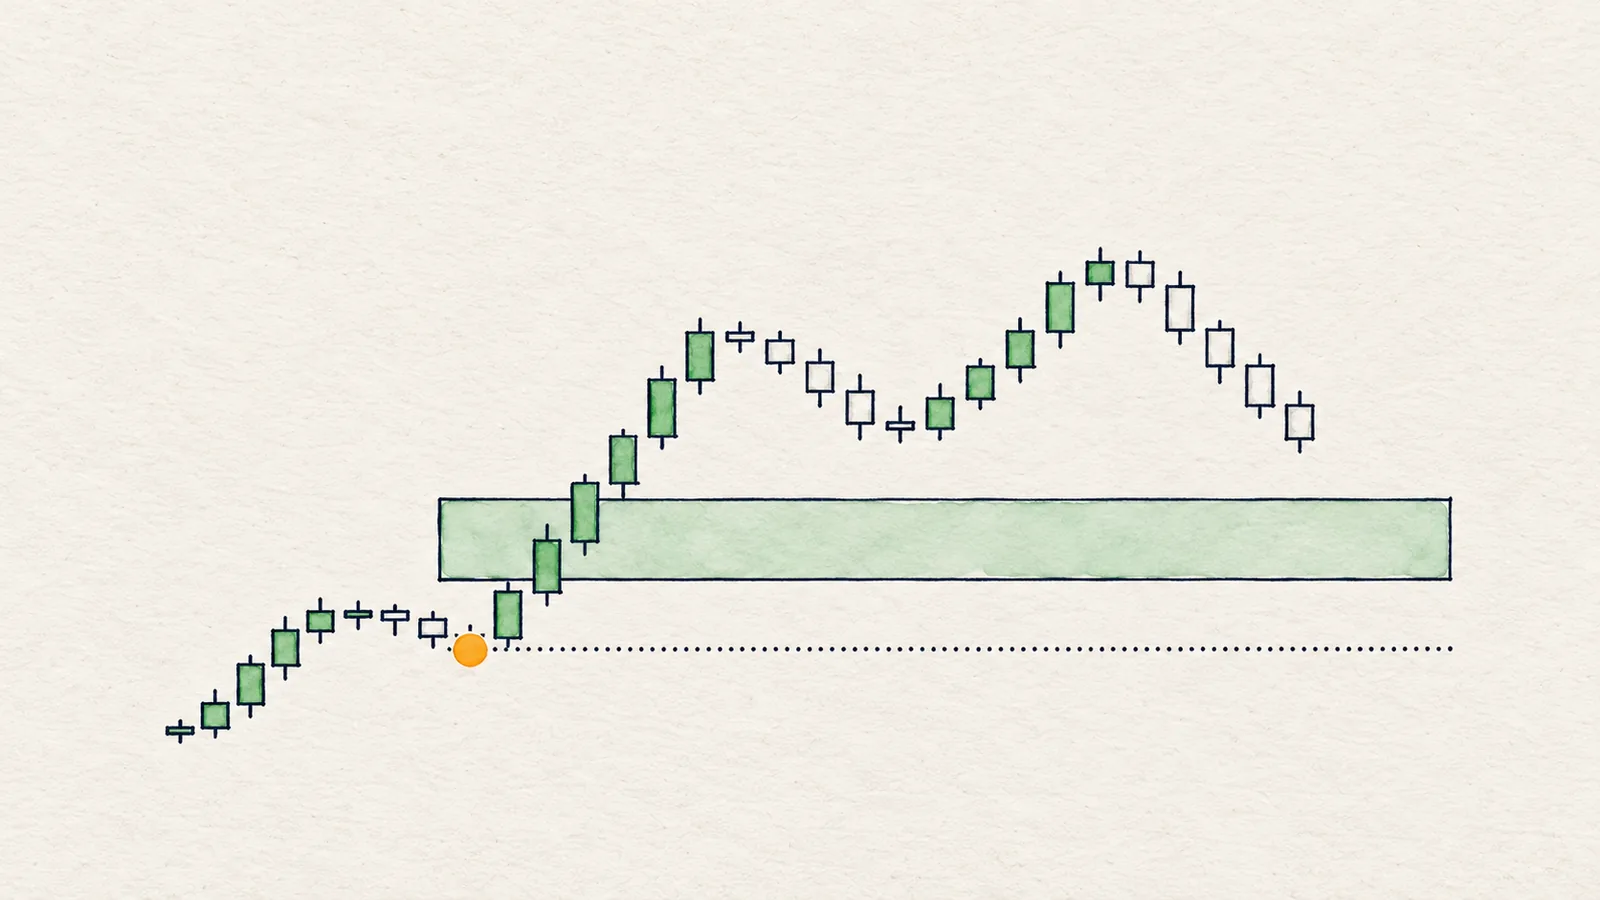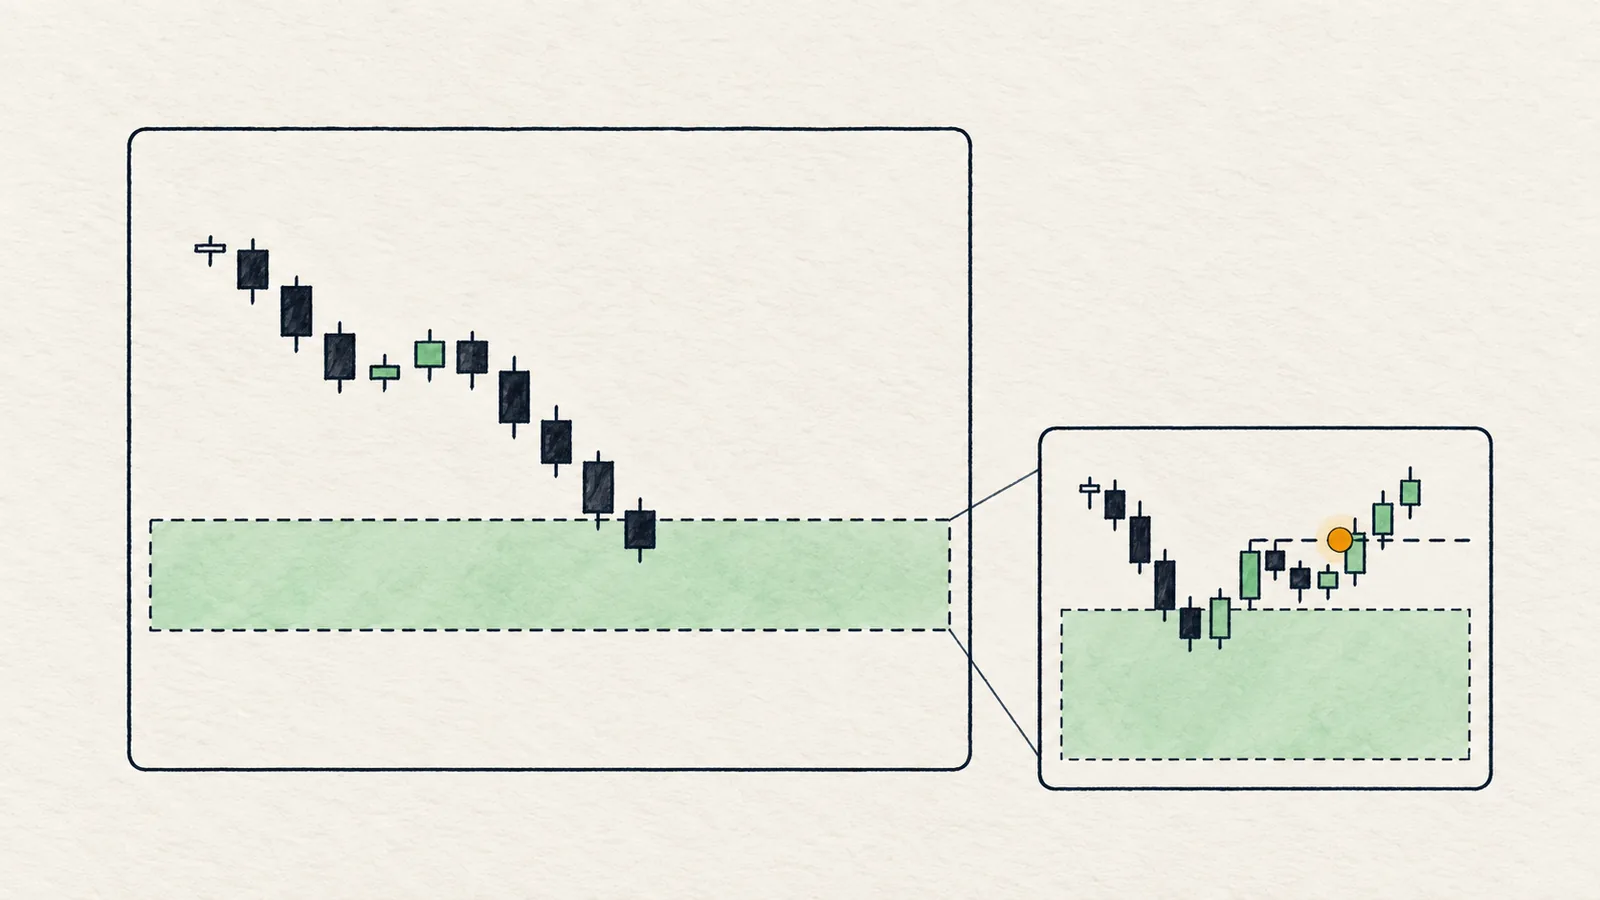
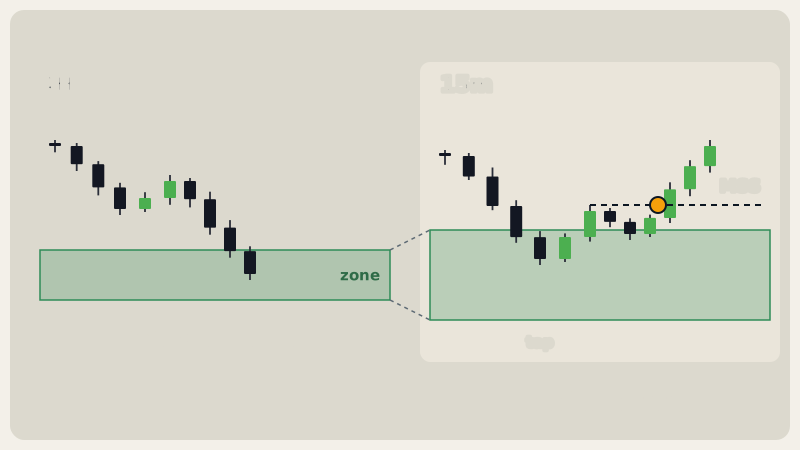
Lower timeframe confirmation is a top-down method: choose an area of interest on a higher timeframe, such as a 4H demand or supply zone, then wait for a market structure shift on a lower timeframe, such as the 15-minute chart, while price is inside that area. The zone answers where to look; the lower-timeframe shift answers whether price is reacting there.
The idea solves a real problem. A zone is only a place where something might happen, and a touch alone proves nothing. Many traders enter at the touch, watch price slice through, and then feel the zone "failed". Waiting for a small, early piece of evidence is a way to avoid entering blind. This guide explains how to do it step by step, what the arithmetic of stops looks like, why the method can over-filter, and how a real read treats a 15m check.
What is lower timeframe confirmation?
It is a two-layer process. The higher timeframe (HTF) sets the context and the area: a zone, a key level, a swing that protects the idea. The lower timeframe (LTF) sets the timing: it shows how price behaves once it enters that area.
Think of the HTF as a map and the LTF as a magnifying glass. The map says there is a possible reaction point here. The magnifying glass shows whether anything is actually reacting. Neither replaces the other. A 15m shift without an HTF zone is just a 15m wiggle, and a zone without any lower-timeframe evidence is a hope.
This builds directly on multi-timeframe analysis: the higher timeframe usually carries the direction, and you use the lower timeframe to fine-tune the moment.
What is a market structure shift on the 15m?
A market structure shift (MSS) is the same idea as a break of structure or a change of character from the BOS vs CHoCH guide, just on a smaller chart: a candle close beyond the last confirmed swing, against the move that carried price into the zone.
- For a long in a demand zone: price has been falling into the zone and printing lower highs. The shift is a 15m close above the last lower high.
- For a short in a supply zone: price has been rising into the zone and printing higher lows. The shift is a 15m close below the last higher low.
Close, not wick. A 15m wick through a swing that closes back inside is a liquidity sweep, a different event. In fact, a sweep of a small low inside the zone followed by a shift back up is one of the most common patterns people look for.
How do you use it step by step?
- Set the direction on the higher timeframe. Is the 4H and daily structure bullish, bearish or mixed? Confirmation works better when you are trading with the larger picture.
- Mark the zone. It might be a demand or supply area, a fair value gap, or a level with several tests. Draw it as a band, not a line.
- Mark the invalidation first. Find the swing on the higher timeframe whose loss cancels the idea. Write the price down before the entry exists.
- Wait for price to reach the zone. If price is not in the zone, there is nothing to confirm yet. This is the step people skip.
- Switch to the lower timeframe and mark its last swing. For a long, the last lower high; for a short, the last higher low.
- Wait for a 15m close beyond that swing. That is the shift.
- Plan around the shift, not at the shift. Some traders enter on the break; others wait for a pullback to the broken level. Either way, the plan has an if/then and an invalidation.
Why does a lower-timeframe shift help?
Three reasons, none of them magic.
It turns a touch into a reaction. Price touching a zone is neutral. Price entering a zone and then breaking a small swing against its previous move is a piece of evidence that someone is responding.
It gives you a more precise reference. Instead of the whole zone, you now have a small swing low or high from the 15m chart. That helps you place entries and think about risk with finer detail. The invalidation, however, should normally stay with the higher-timeframe swing; read where to place invalidation before moving a stop closer just because the lower timeframe allows it.
It forces patience. You wait for something specific rather than reacting to every candle. This is the real benefit for many people: it reduces impulsive entries.
A quick illustration with made-up numbers: say the 4H demand zone is 100 to 102 and the swing that protects the idea is at 98. Entering blindly at 102 puts the invalidation 4 points away. If price dips into the zone, makes a 15m low near 100.5 and then closes above the last 15m lower high around 101, the entry is at 101 and the same invalidation is 3 points away, while price has also shown a small reaction. The gain is modest: slightly better price and some evidence, not a different trade.
When does lower timeframe confirmation over-filter?
This is the part tutorials leave out.
Price may never come back. In strong trends, price often turns without a pullback to a zone. If you only act when a zone, a shift and a retest all line up, you will watch plenty of moves from the side.
The shift can arrive late. By the time a 15m structure break prints, the best price may be behind you and the nearest target closer. Decide whether the remaining distance still justifies the risk.
The 15m is noisy. Small timeframes produce lots of swings and lots of breaks. A shift can be undone two candles later, and a sequence of shifts in both directions inside the same zone tells you nothing except that price is chopping.
More conditions rarely means more certainty. Every added filter shrinks the number of setups. With enough filters, there is nothing left to do, and the temptation is to loosen them after the fact.
It does not replace invalidation. A confirmed entry that has no defined stop is still an unmanaged one.
Tip: Decide before the trade which condition counts as enough: a 15m shift, or a rejection wick, or neither. Writing it down stops you from moving the goalposts mid-trade.
What does a lower-timeframe check look like on real charts?
A bearish read still waiting for confirmation: DOT 4H, close of 8 Oct 2026
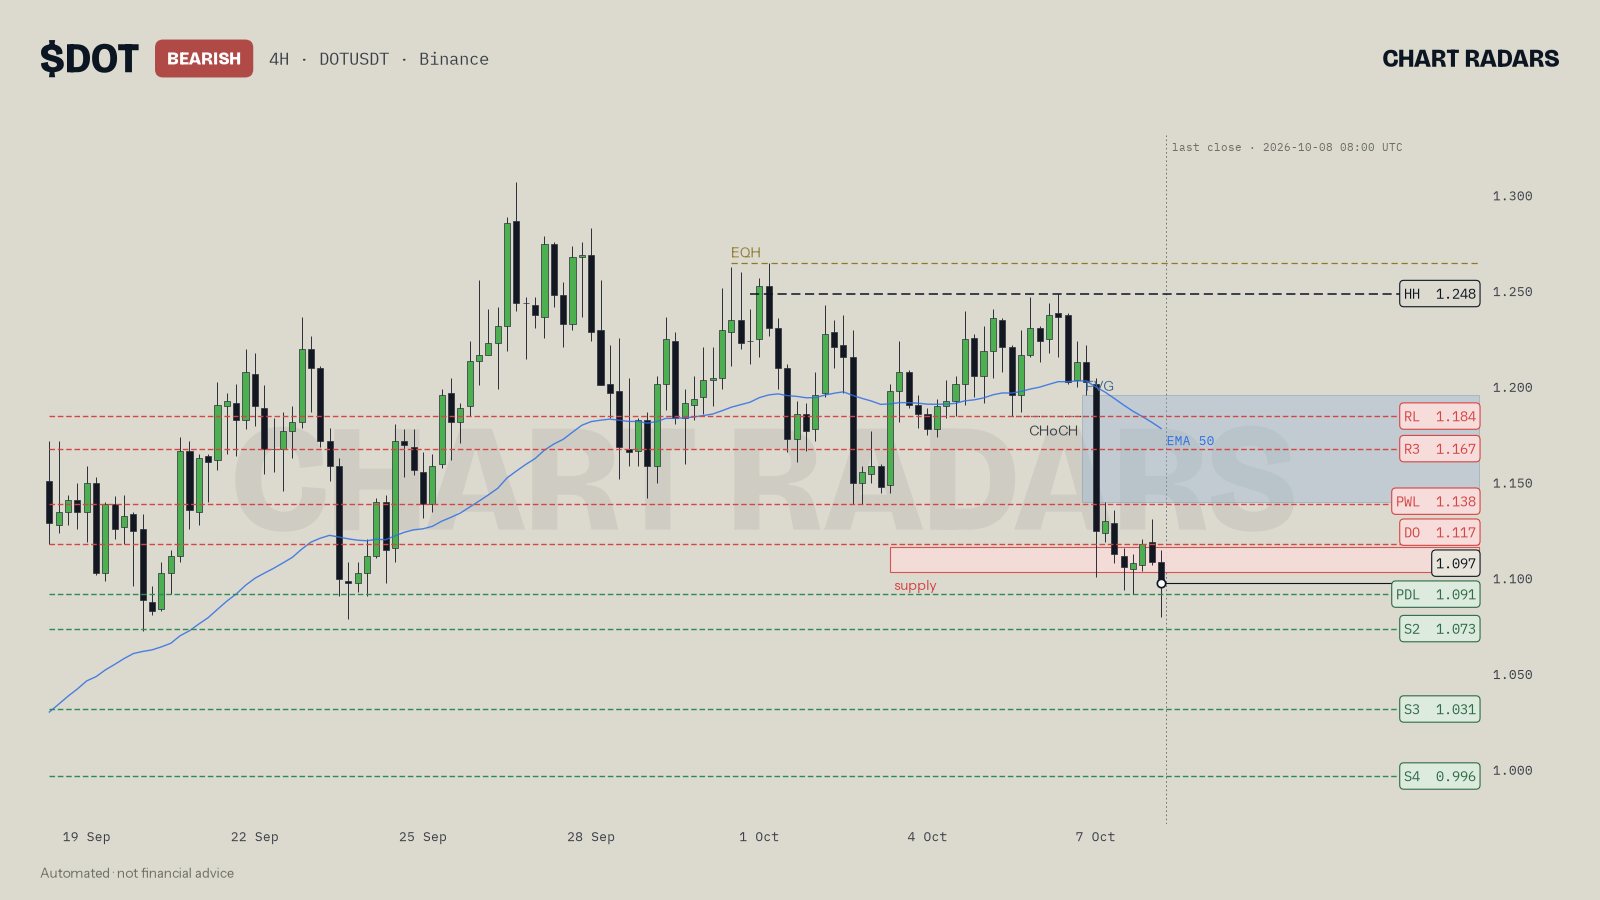
The chart is labelled BEARISH: structure on 4H, 1D and 1W agree. Price closed at 1.097, below the supply zone the read names at 1.103 to 1.115, which is drawn on the chart as the pink box just above the last candle. The read's preferred entry is a bounce into that zone, with the idea staying valid while a 4H close above 1.248 does not occur. About the lower timeframe, the read is explicit: 15m has not shifted down yet, so it would wait for that structure shift, or a long upper wick, instead of selling blind. This is the method in miniature: HTF direction and zone first, LTF evidence second, and a stated invalidation at 1.248.
A bullish read waiting for the 15m to turn: NEAR 4H, close of 8 Oct 2026
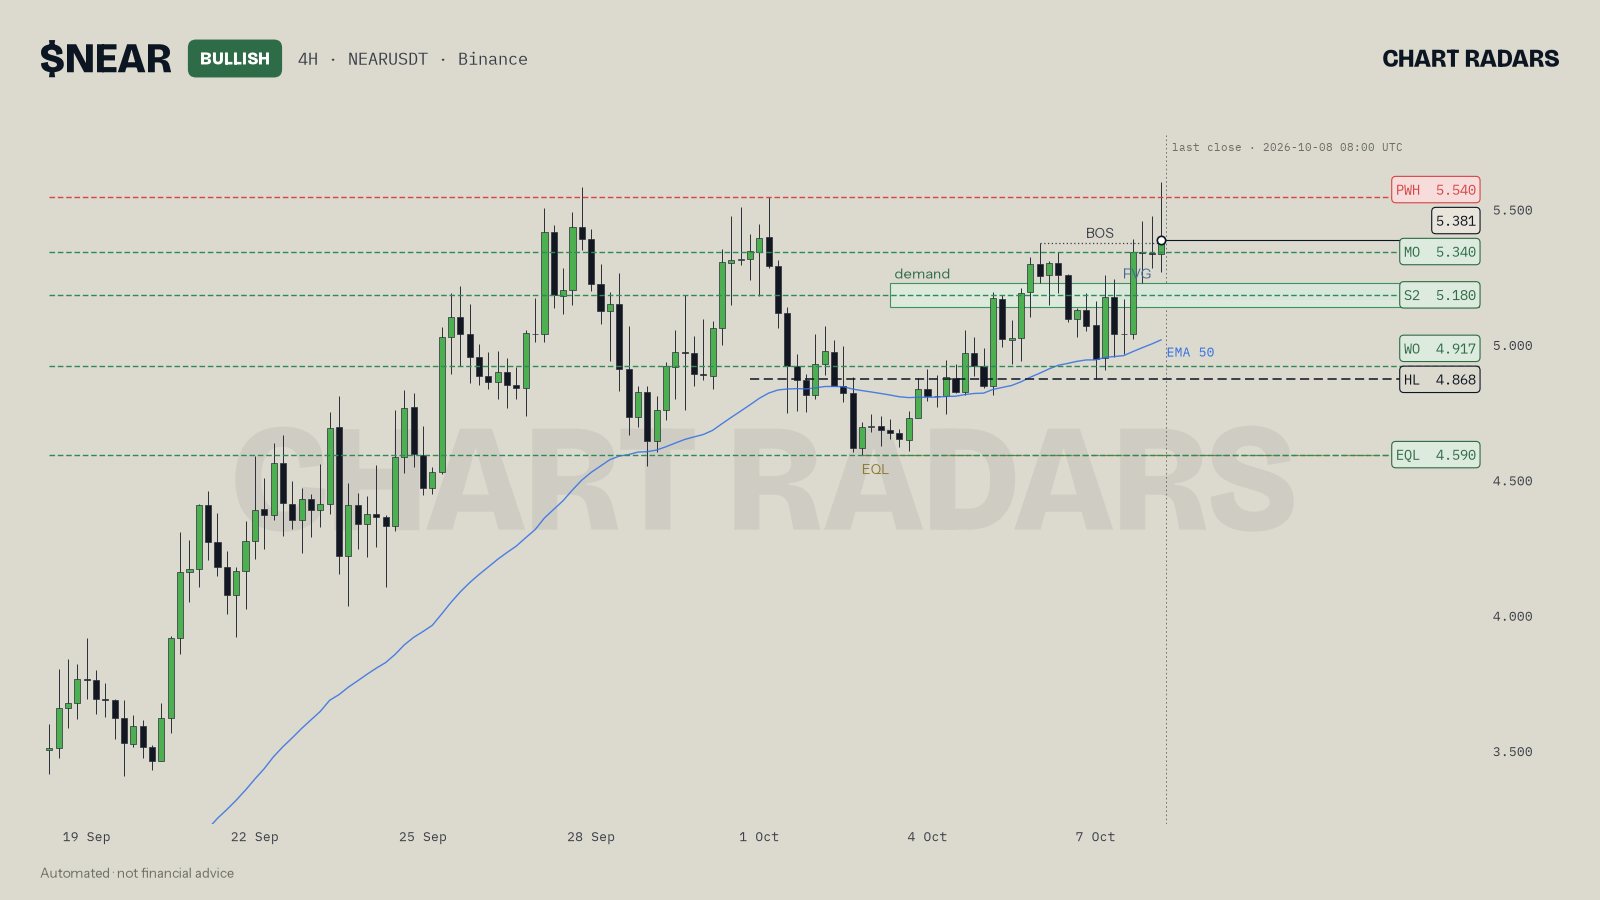
The chart is labelled BULLISH, with the last break marked BOS. Price closed at 5.381, above the demand and fair value gap area at 5.135 to 5.225 that the read wants to see tested before more upside, with the idea holding while 4.868 holds. The read adds that the 15m is still shifting down, so it would wait for it to turn back up before touching a long. Here the lower timeframe is doing the opposite job to the DOT example: it is not saying "go"; it is saying "not yet", which is what a confirmation tool is mostly for.
In Chart Radars: On 1H and 4H reads the bot also looks at the 15m chart. If a market structure shift happened within the last 16 candles of the 15m (the last 4 hours) and price touched the zone at that time, the read says the 15m has confirmed. If not, it says the 15m has not shifted yet, or is still moving the wrong way, and suggests waiting for a shift or for a rejection wick. The 15m check is not used on 1D reads because it adds noise there. The zone itself is an open FVG and/or the nearest level (within 0.2 ATR), no more than 5 ATR from price, and the invalidation is the nearest protecting swing at least 1 and at most 6 ATR from the entry.
Honest note: A lower-timeframe shift is a small piece of evidence, not a verdict. Price can print a clean 15m shift inside a zone and still run straight through it, and it can reverse from a zone with no shift at all. Chart Radars treats the 15m as a reason to wait or to act with a bit more information, never as a promise, and says plainly when the shift has not happened.
Key takeaways
- Lower timeframe confirmation means a higher-timeframe zone first, then a lower-timeframe structure shift inside it.
- A shift is a candle close beyond the last confirmed swing on the small chart, against the move into the zone. A wick through is a sweep.
- The benefit is evidence and patience, plus a slightly better reference point; it is not a way to remove risk.
- Keep the invalidation on the higher-timeframe swing and write it down before you enter.
- Over-filtering is real: extra conditions mean missed moves, late entries and 15m noise. Decide in advance how much confirmation is enough.
Frequently asked questions
What is lower timeframe confirmation?
It means picking an area on a higher timeframe, such as a 4H zone, and then waiting for a break of structure on a lower timeframe, such as 15m, while price is inside that area. The zone says where, the lower timeframe says whether price is reacting.
Which lower timeframe should I use for confirmation?
A common pairing is 15m for 1H to 4H zones, and 1H for daily zones. The lower timeframe should be small enough to react quickly but not so small that every wiggle looks like structure.
What is a market structure shift on the 15m chart?
A candle close beyond the last confirmed swing on the 15m chart against the move that brought price into the zone. For a long, it is a close above the last lower high; for a short, a close below the last higher low.
Does lower timeframe confirmation make a trade safer?
It can filter out some entries where price simply keeps going through the zone, but it does not fix outcomes, and it can also cost you a better price or the whole move. Treat it as a way to wait for evidence, not as a promise.
Can you wait too long for confirmation?
Yes. If you require every possible condition, price may already have left by the time they line up, and your stop distance can end up larger than the opportunity. Decide in advance how many conditions you need and stop adding.