The previous day high and low (PDH and PDL) are the highest and lowest prices traded during the last completed day. The previous week high and low (PWH and PWL) are the same measurement for the last completed week. Because they are fixed once the period closes, they work as clear reference levels.
Of all the lines you can draw on a chart, these are among the easiest to agree on. Any trader can look at yesterday's range and see the same two numbers. That shared view is the whole reason they matter: lots of people place orders in the same few spots, and price tends to behave differently when it reaches those spots.
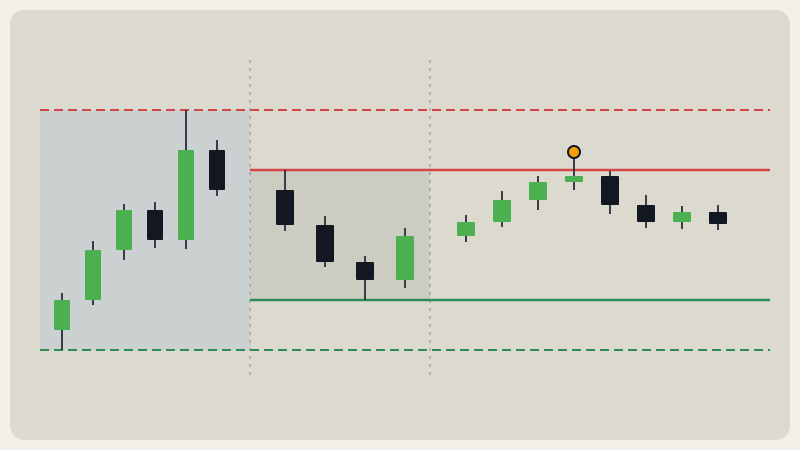
What are PDH, PDL, PWH and PWL?
- PDH: previous day high, the highest price of yesterday.
- PDL: previous day low, the lowest price of yesterday.
- PWH: previous week high, the highest price of last week.
- PWL: previous week low, the lowest price of last week.
The word "previous" is important. Today's high and low are still moving, so they are not reliable reference points. Yesterday's and last week's are finished. They no longer change, so you can plan around them in advance.
Days and weeks follow a fixed clock, normally UTC, the same way the weekly, daily and monthly opens do. In a 24/7 market the day closes at 00:00 UTC, and one candle's close is the next one's open.
Why do stops and orders cluster beyond them?
Think about where a trader who is long puts a protective stop. The common answer: just below the most recent obvious low. For a trader who is short, it is just above the most recent obvious high. The previous day's low and high are exactly those obvious spots.
That creates a few kinds of resting orders:
- Stops of traders on the wrong side, placed just beyond the level.
- Breakout orders from traders who want to enter if price moves through it.
- Take-profit orders from traders who entered earlier and aim at the level.
All of them sit at nearly the same prices. When price gets there, those orders get triggered, and the market can move quickly. Orders being triggered, not magic, is the reason price often makes a sharp move near a PDH or PDL.
What does price do when it reaches them?
Three outcomes are common, and the difference is read from candle closes.
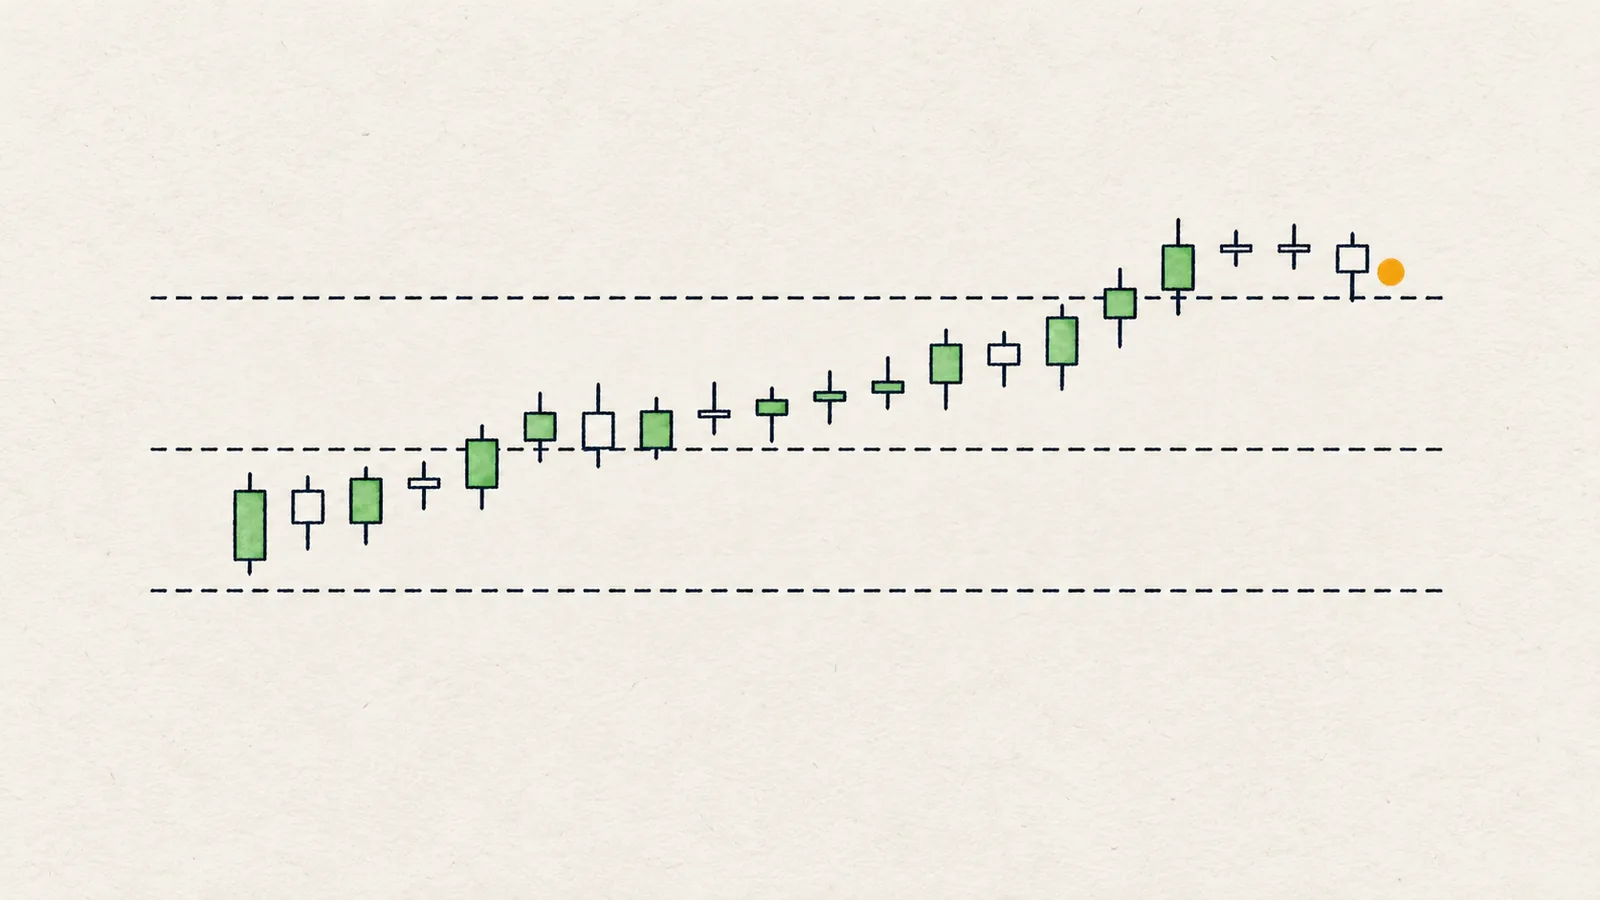
- Rejection. Price touches the level and turns without going through. The level held for now.
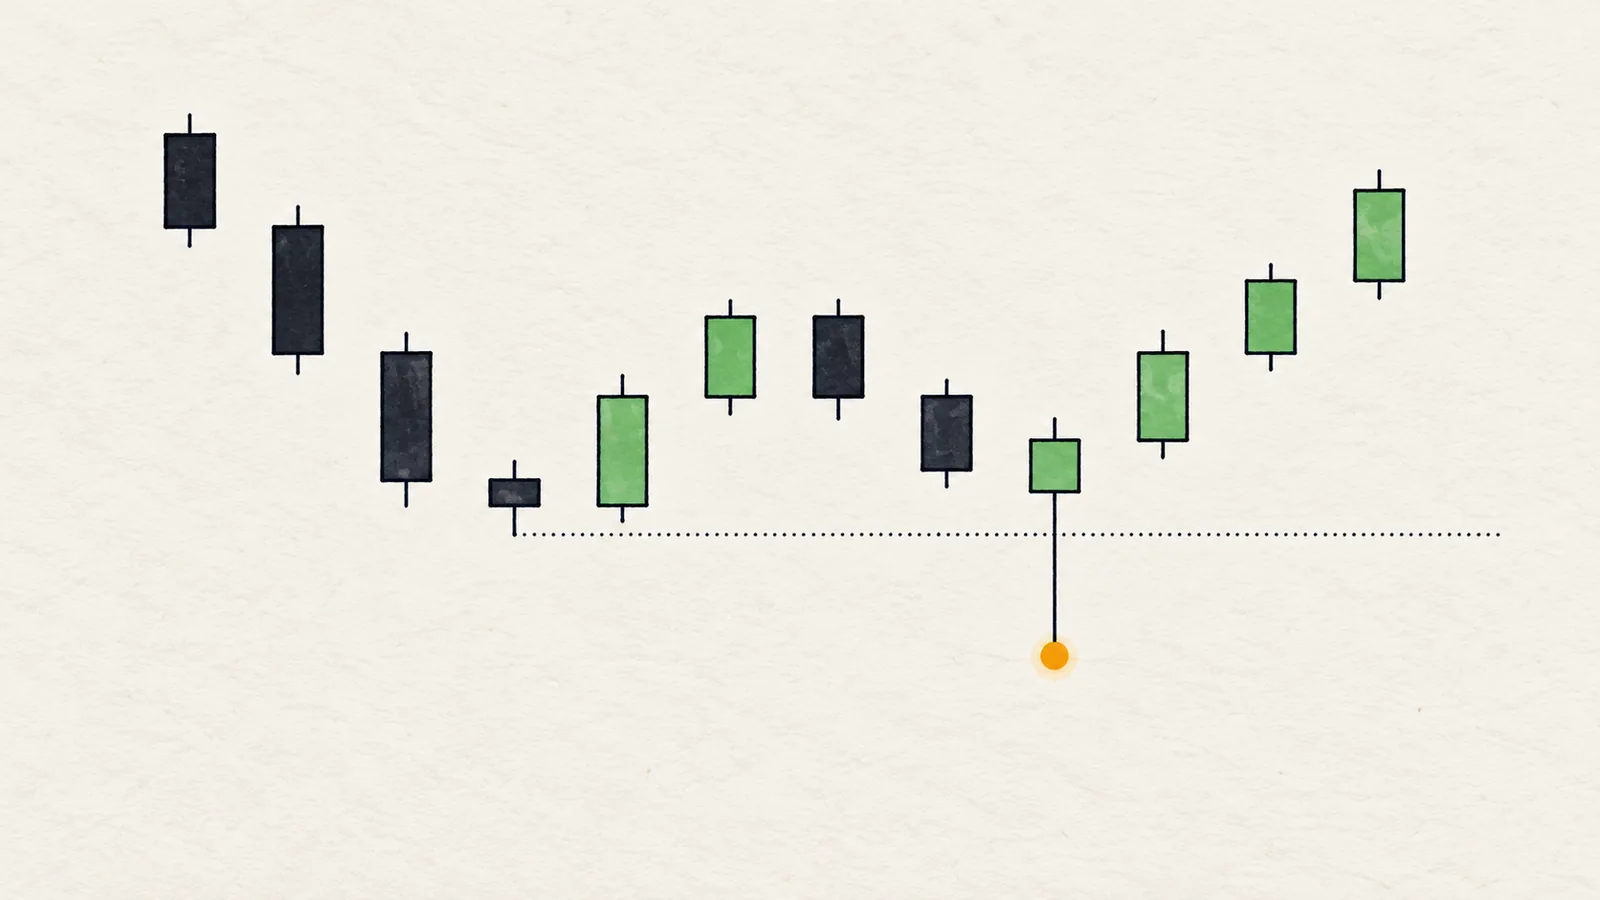
- Sweep. A wick goes beyond the level, triggers the stops resting there, and the candle closes back inside. The stops fed the move, and then the move lacked follow-through. See the liquidity sweep guide for how to recognise this.
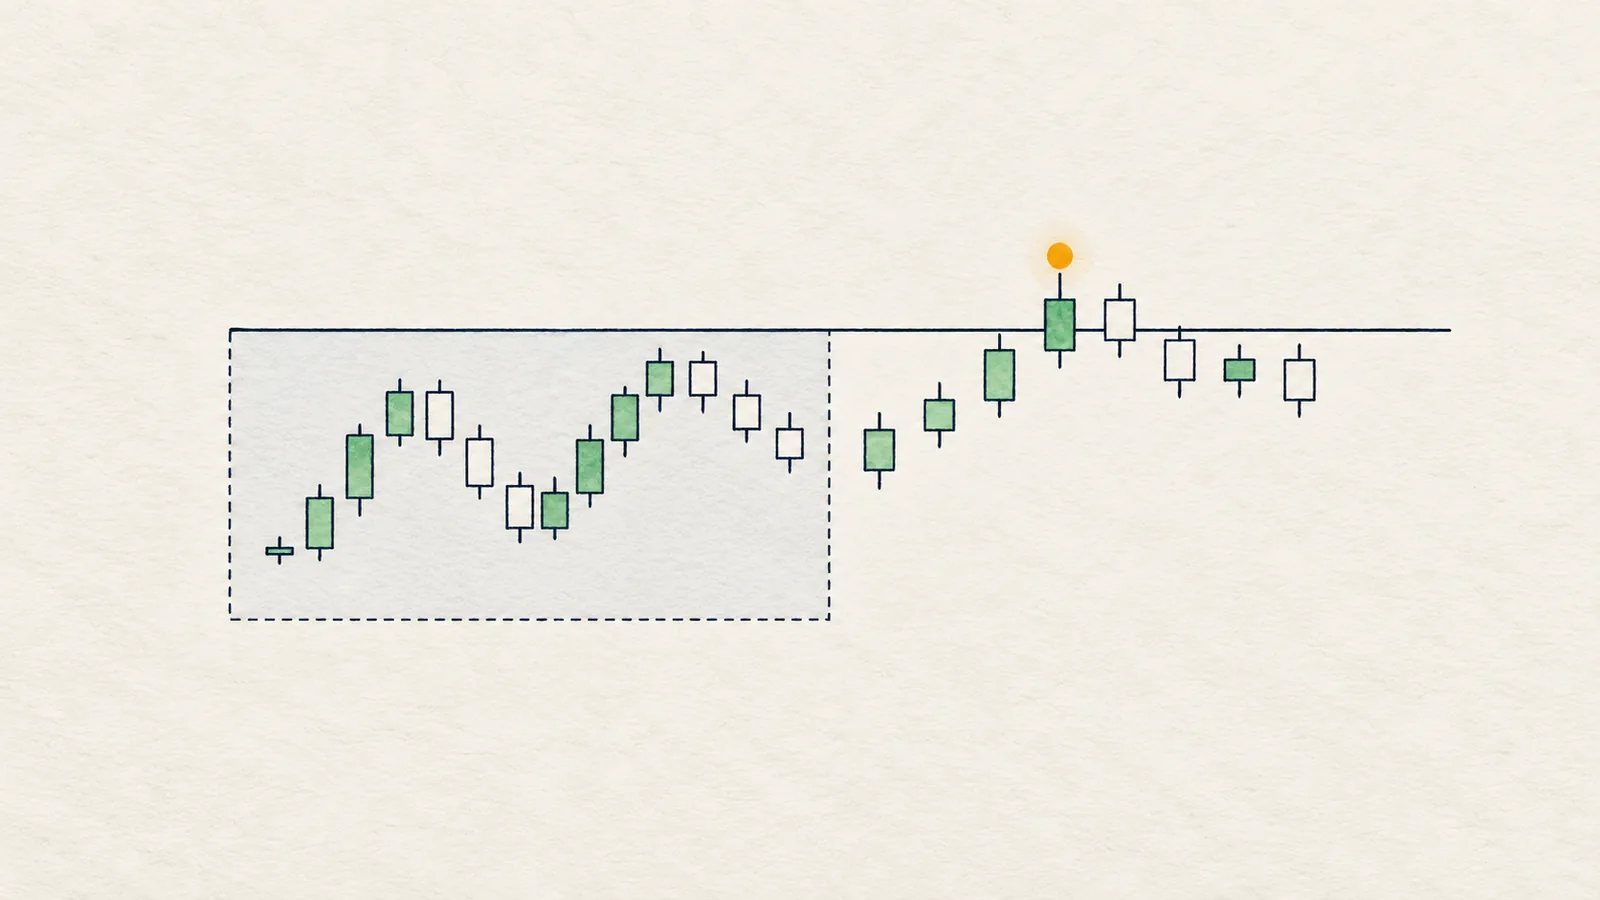
- Break. A candle closes beyond the level, and later candles hold beyond it. The level gave way.
These three are a better way to think than "support held" or "support failed", because they tell you what to do next. A rejection invites a wait for confirmation, a sweep is a place to watch for a reclaim, and a break moves you to the next level.
How do you use them as range edges?
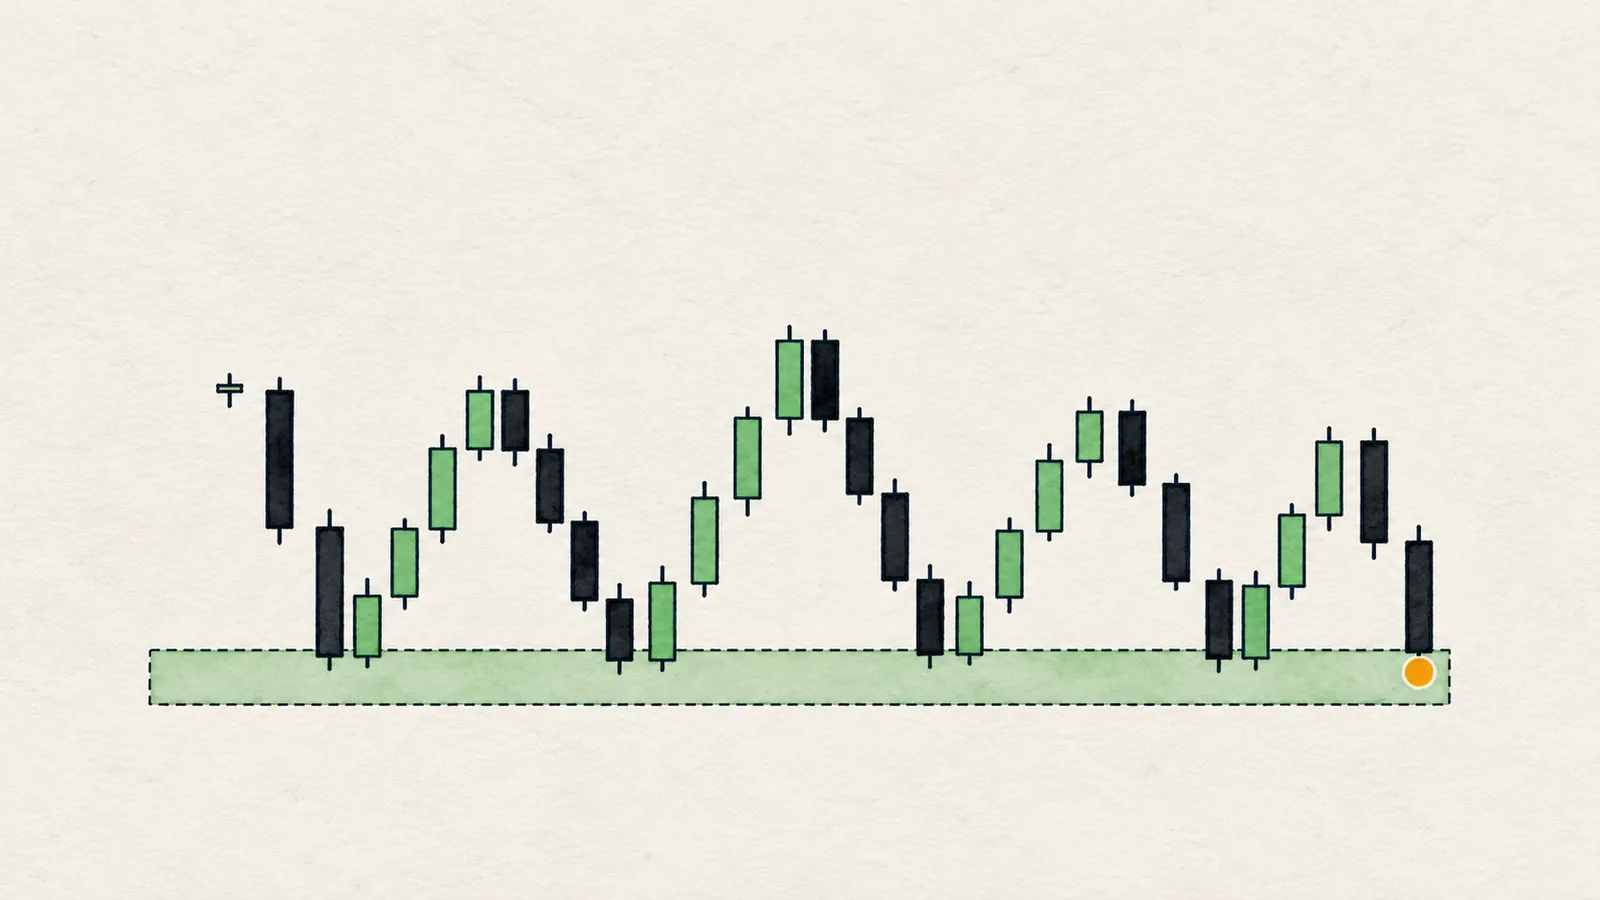
When price has been moving between a recent high and low, the PDH or PDL can act as the edge of the day's range, and the PWH or PWL as the edge of the week's range. This is useful because the middle of a range has no edge. Trading in the middle risks being stopped out by noise, while edges give you a clear place to be right or wrong.
A simple framework:
- Near the PDL (or PWL): look for a sweep and a reclaim. If a wick goes below and the candle closes back above, the lows were taken and price may rotate up. If a candle closes below instead, the range may be breaking down.
- Near the PDH (or PWH): look for the mirror image. A wick above that closes back inside suggests the highs were taken; a close above suggests a breakout.
- In the middle: wait.
How do day and week levels differ?
The weekly levels carry more weight because more time and more traders went into them, so a PWH or PWL is a bigger target than a PDH or PDL. When both sit near each other, the cluster is a stronger reference than either one on its own. When price sweeps the PDL on a Monday and stops at the PWL, that overlap is worth marking.
How do you write an if/then plan with them?
Plan before price arrives, with a condition, a next step and an invalidation.
- Reclaim plan: "If price sweeps the previous day low and a 4H candle closes back above it, the long idea is active, and the invalidation is a close below the sweep's low."
- Breakdown plan: "If a 4H candle closes below the previous day low, the range is over, and the next reference is the previous week low."
- Fakeout plan: "If price closes above the previous day high but falls back inside within a few candles, I treat the break as failed."
Combine them with levels that come from swings, as described in support and resistance. A previous-day low that also matches a swing cluster, or sits next to a pair of equal lows (see equal highs and lows), is more interesting than a lone line.
When do they mislead?
- Thin or fast markets. In a violent move the levels can be passed in a single candle and tell you nothing.
- Right after the day rolls. Early in the new day the previous range is wide and price has not yet done much, so the information is thin.
- Too many lines. Four lines plus swings plus opens can crowd a chart. Keep the nearest ones.
- Treating them as walls. A level is a place where orders sit. It is not a barrier.
- Ignoring the close. The wick tells you how far price reached. The close tells you what it decided.
In Chart Radars: the previous day high and low and the previous week high and low appear on the chart as PDH, PDL, PWH and PWL. They take part in level naming: when candidates sit within 0.25 ATR of each other, the engine keeps one name in this order: equal highs/lows, previous-week high/low, monthly open, weekly open, and then the previous day, daily open and plain swing cluster. A level's "tested N times" counts swings within 0.3 ATR of it, and levels are considered only up to 12 ATR from price.
Honest note: a sweep of the previous day low is not a reason to buy, and a break of the previous day high is not a promise of continuation. These levels tell you where orders are likely resting, not what the next candle will do. Plenty of sweeps are just the first step of a real breakdown.
What does it look like on a real chart?
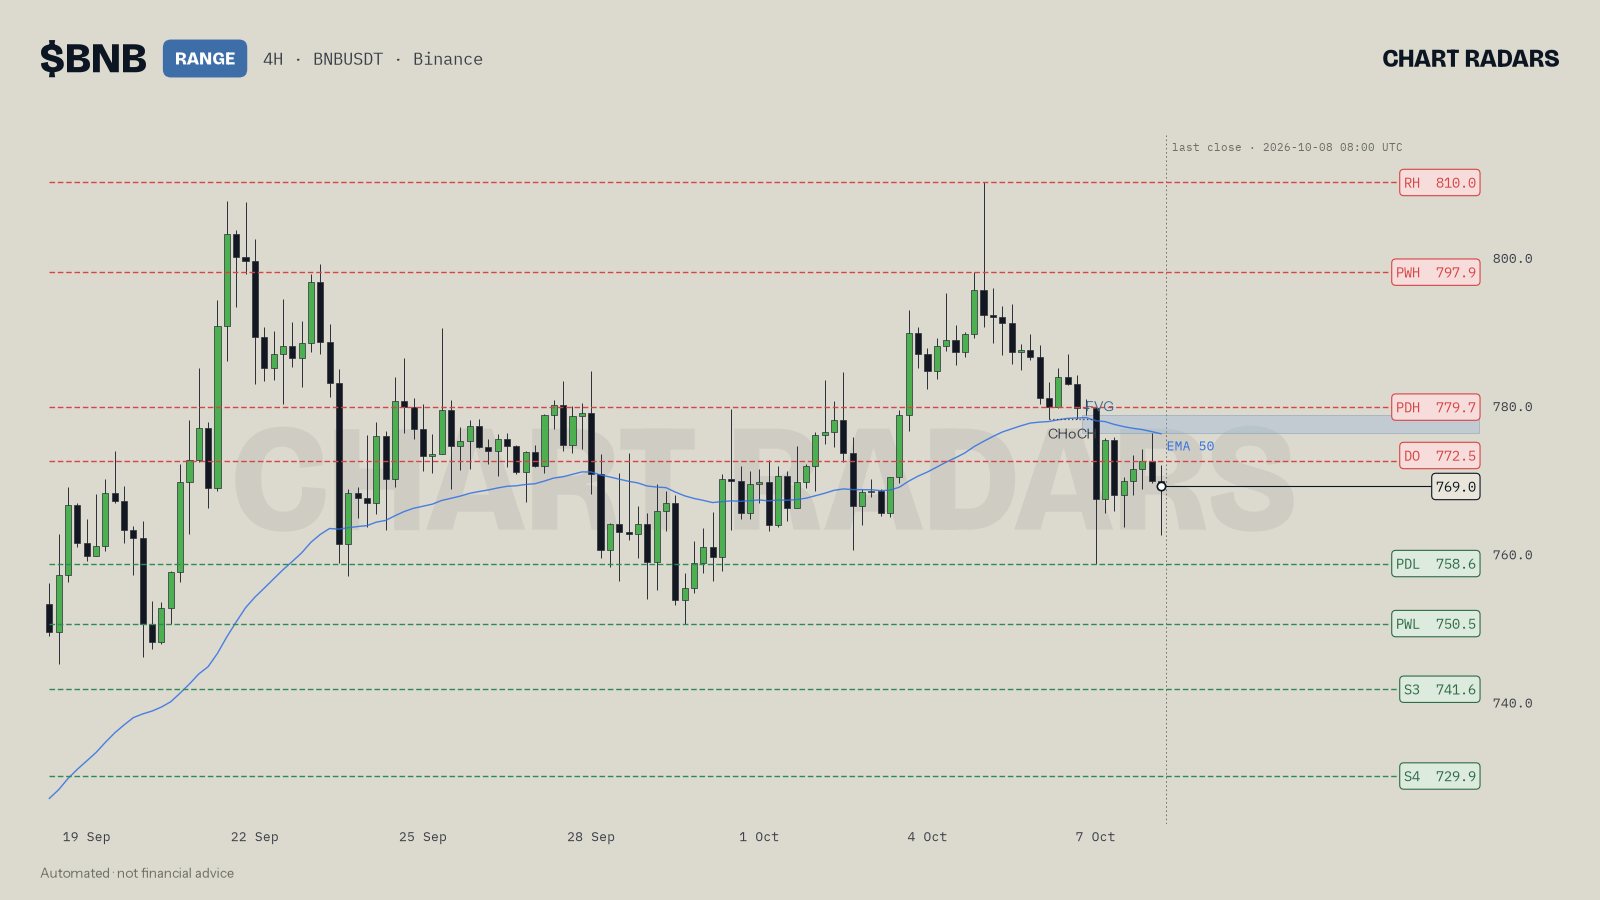
BNB 4H, close of 8 Oct 2026. Price is at 769.0, between the daily open at 772.5 and the prior-day low (PDL) at 758.6. The chart shows the prior-day high (PDH) at 779.7 above price, the prior-week high (PWH) at 797.9 and the range high at 810.0, with the prior-week low (PWL) at 750.5 below. The bot's read treats the 758.6 prior-day low, listed as tested 4 times, as the lower edge of the 758.6 to 810.0 range: longs make sense only after a sweep of it gets reclaimed, and a 4H close below it ends the range with 750.5 as the next stop.
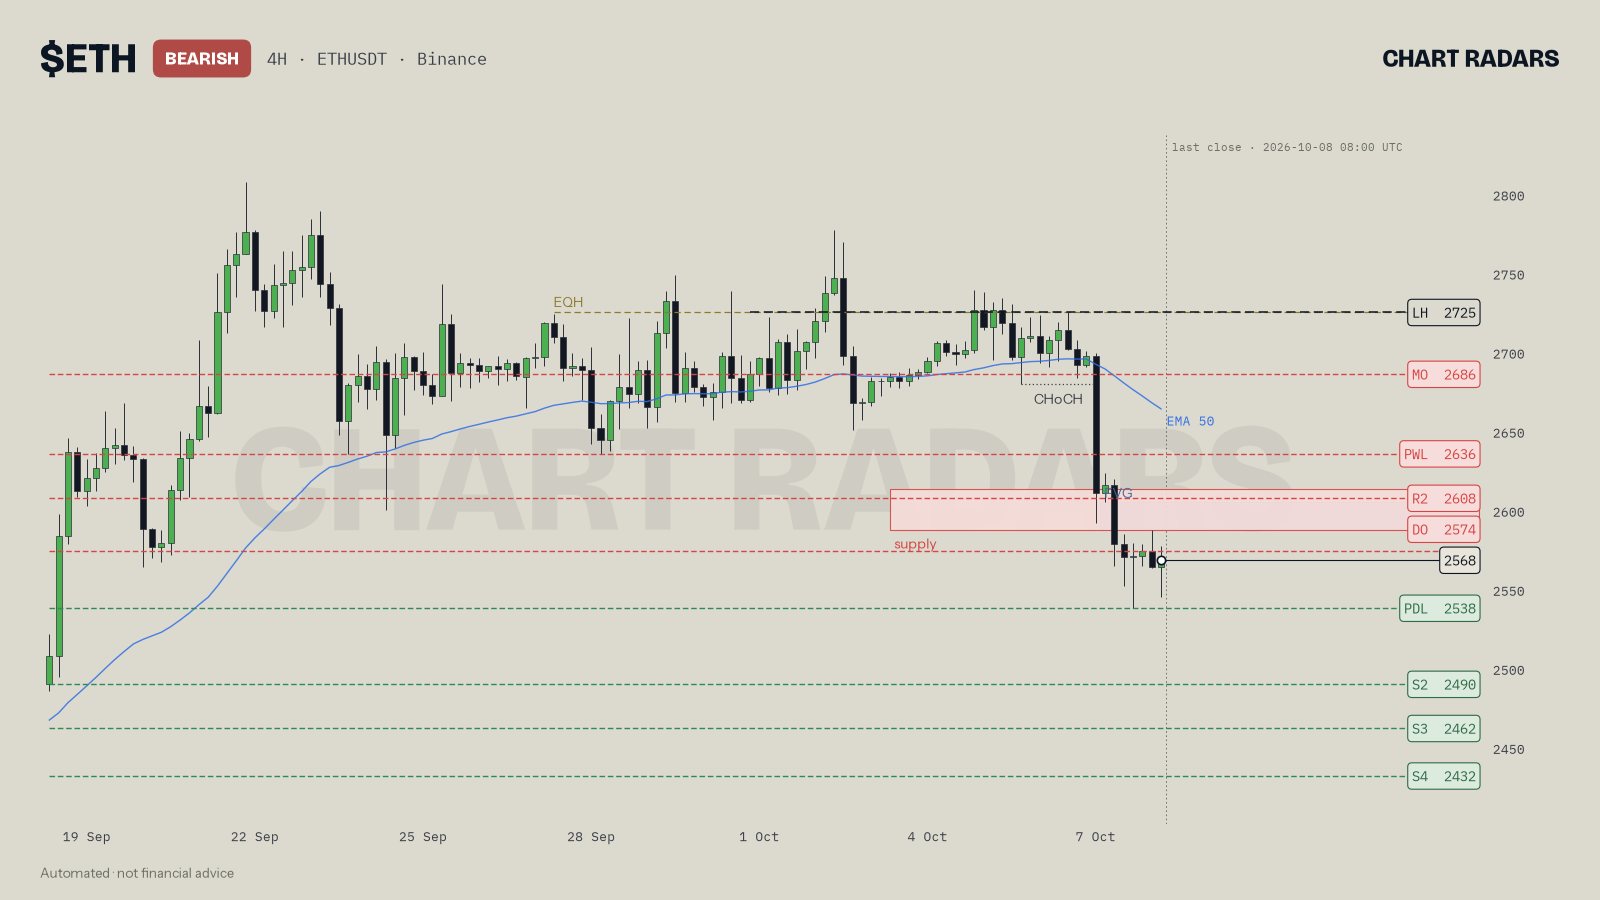
ETH 4H, close of 8 Oct 2026. Price is at 2568, above the prior-day low (PDL) at 2538 and below the prior-week low (PWL) at 2636, which is itself above the daily open at 2574. The read lists the 2538 prior-day low as tested 9 times and describes the path lower as running through it on a 4H close, after a bounce into the supply zone fails. The point for you is how a single named level shows up in three places at once: on the chart, in the count of tests, and in the if/then condition.
Key takeaways
- PDH, PDL, PWH and PWL are the highs and lows of the last completed day and week, fixed and easy to agree on.
- Stops, breakout orders and profit targets cluster just beyond them, which is why price moves fast there.
- Read what happens at the level from the close: rejection, sweep or break.
- Use them as range edges, wait in the middle, and write the invalidation before the trade.
- Week levels weigh more than day levels, and overlaps with swing levels or opens make them stronger.
Frequently asked questions
What is the previous day high and low in trading?
They are the highest and lowest prices reached during the last completed day. Traders mark them as PDH and PDL because they show where the previous day's range ended.
What do PDH, PDL, PWH and PWL stand for?
PDH is previous day high, PDL previous day low, PWH previous week high and PWL previous week low. The week ones cover the last completed week instead of the last day.
Why do traders watch the previous day high and low?
Many traders place stops and breakout orders just beyond them. That leaves resting orders at those prices, so price often reacts or moves fast when it arrives.
Is a break of the previous day high bullish?
Only if candles close beyond it and hold. A wick through the high that closes back inside is a sweep, which is a different event, and often a cautious one.
How is the previous day high different from the daily high?
The daily high is the highest price so far today and keeps changing. The previous day high is fixed once the day has closed, which is why it works as a reference level.