The daily, weekly and monthly opens are the prices at which a new day, week or month starts trading. Plotted as horizontal lines, they show whether price is currently above or below where the period began, which is a simple way to see which side has controlled that period so far.
An open looks almost too simple to matter. Yet a lot of traders glance at the same few lines, and a line many people watch becomes a place where decisions cluster. This guide covers how the opens are defined in a market that never closes, what they tell you, how to use them in if/then plans, and where they mislead.
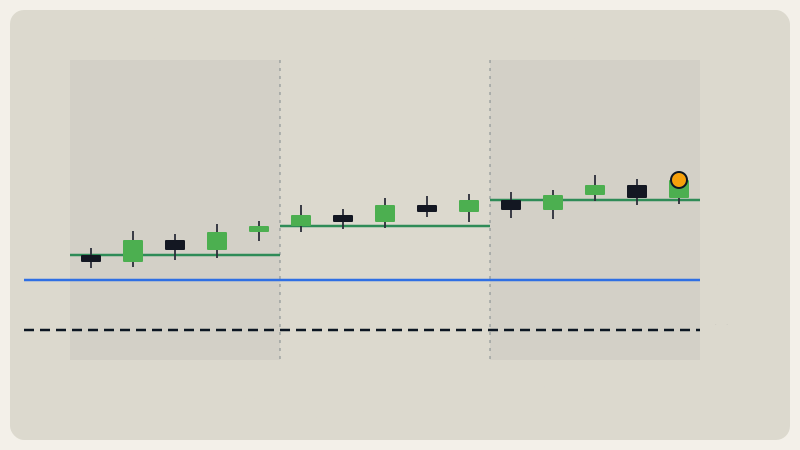
What is the weekly, daily and monthly open in crypto?
An open is the first price of a period. In stock markets this is easy: the exchange opens, and the first trade is the open. Crypto trades 24 hours a day, 7 days a week, so there is no bell. Charts define the opens by a fixed clock instead, and the standard is UTC (coordinated universal time, the world's neutral reference clock).
- Daily open (DO): the price at 00:00 UTC.
- Weekly open (WO): the price at the start of the new trading week, with the week starting on Monday in UTC under the usual convention.
- Monthly open (MO): the price at the start of the new calendar month, 00:00 UTC on the first day.
Because the market never pauses, the new period begins where the previous one ended. The open of a new day is the same price as the last close of the day before. There is no gap to look at, only a line that restarts.
Why does UTC matter?
If your chart platform shows your local time, the "day" may seem to begin at 3 a.m. or 7 p.m. for you. The market does not care. Many data providers, exchanges and traders use UTC, so the line they are all watching is the 00:00 UTC one. When you compare your chart with someone else's, check that both use the same clock first.
Why do traders watch the opens?
Three practical reasons.
1. It splits the period into two camps. Price above the open means buyers have pushed price higher than where the period started. Price below the open means sellers are ahead. It is a crude measure, but it is objective and easy to read at a glance.
2. It is a shared reference. Many traders anchor their view of the day or week to the open. A line that thousands of people look at is more likely to see decisions around it: profit taken, stops placed, entries waited for.
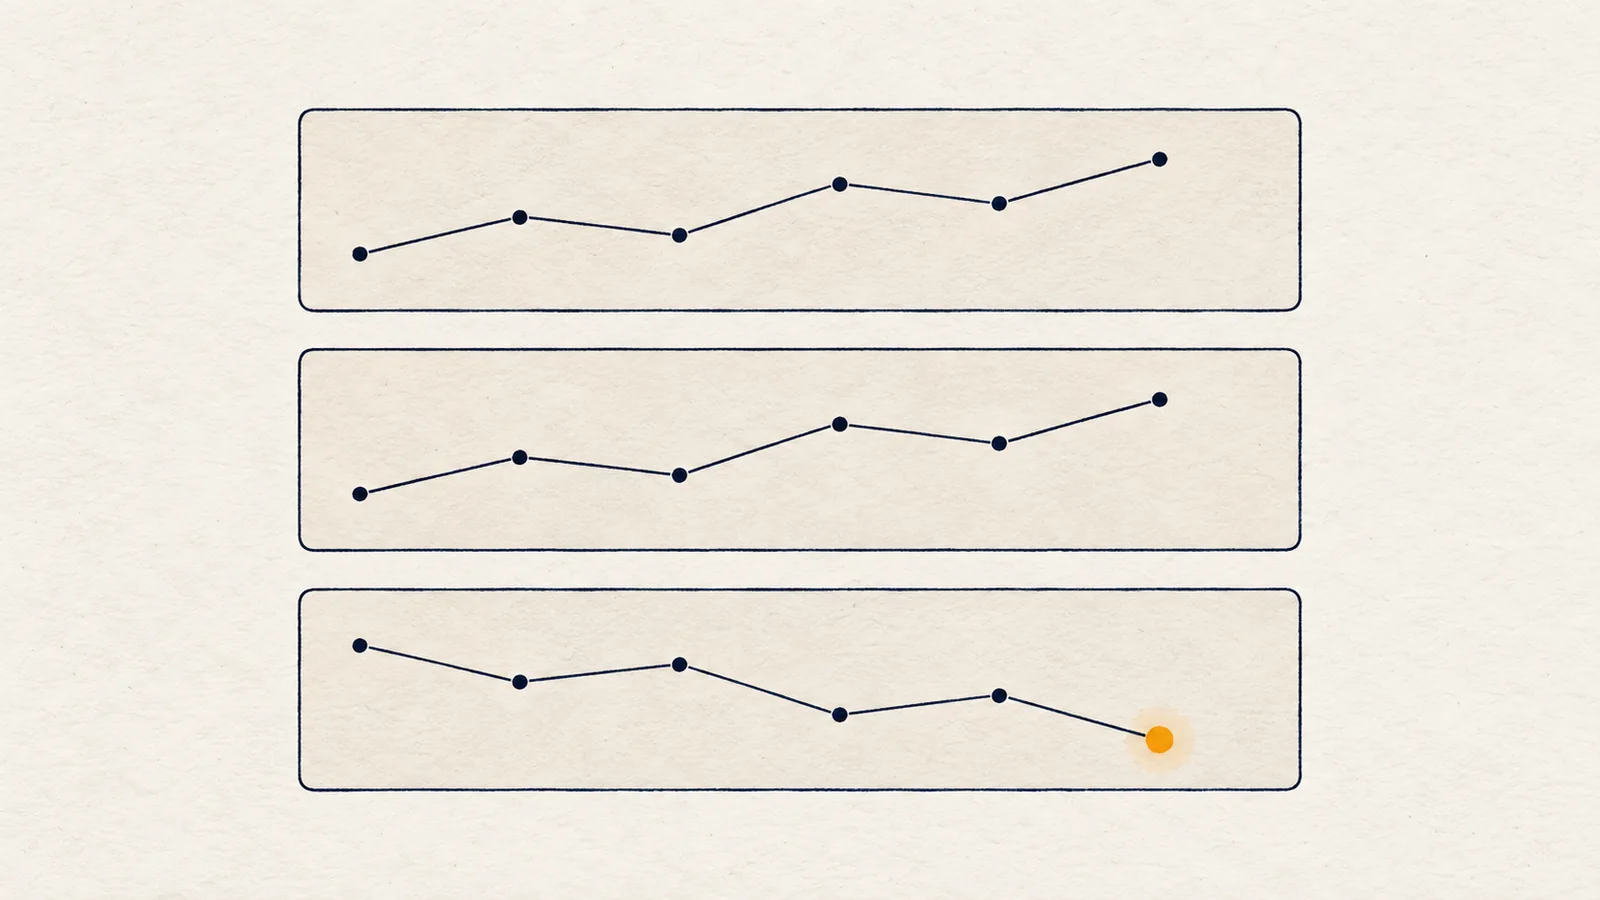
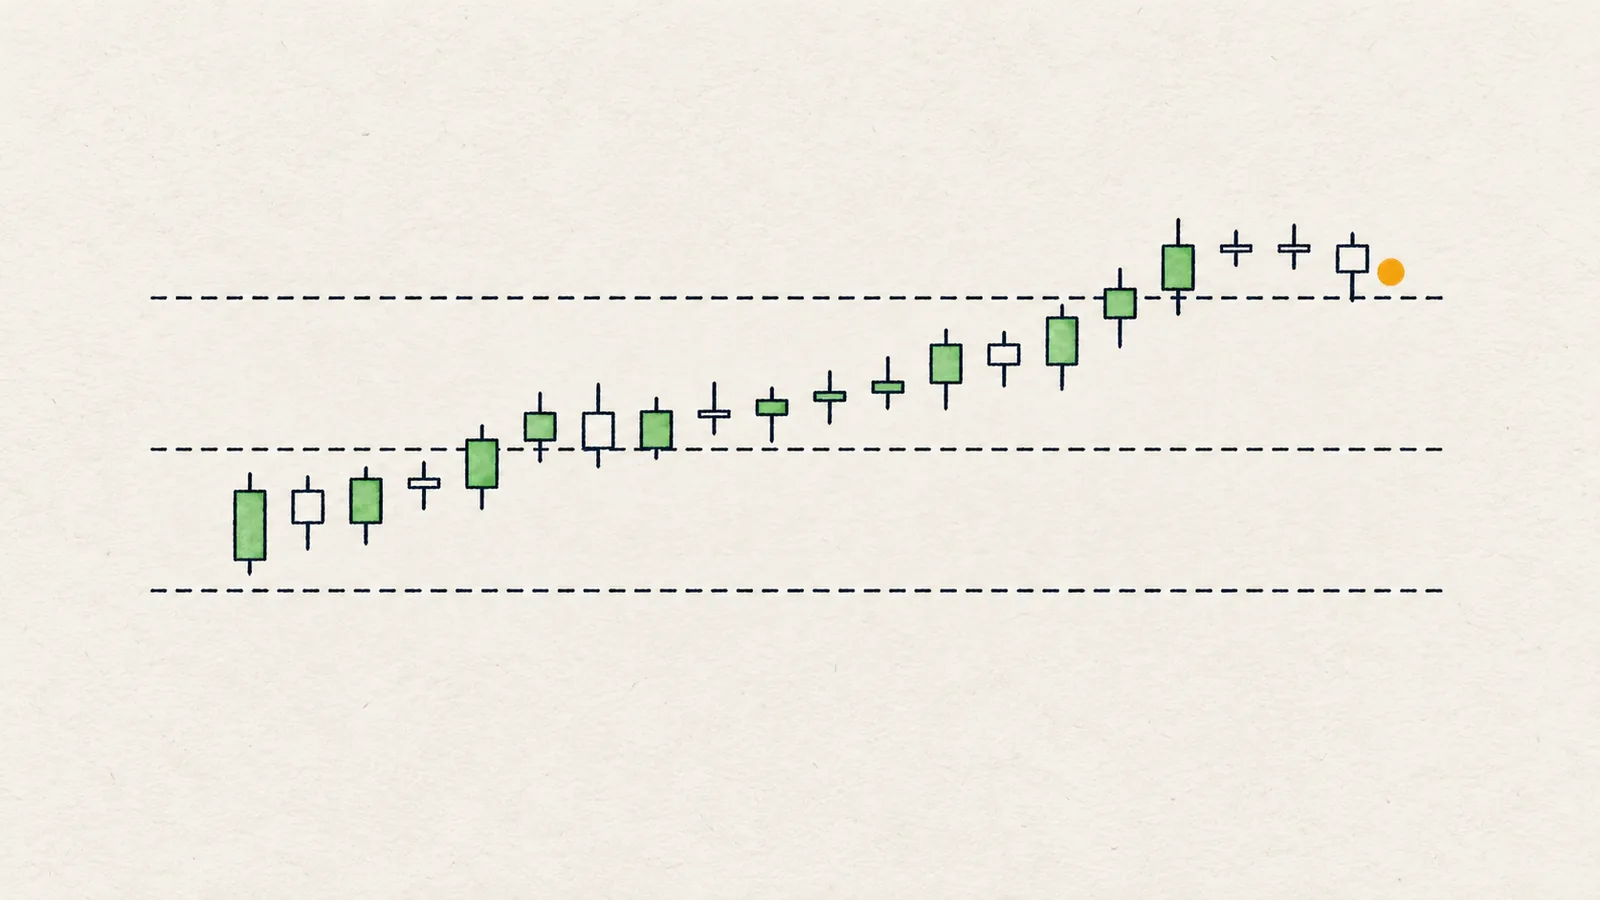
3. It sorts timeframes. The three opens together give a layered view. Price above the monthly open but below the weekly open says "the month is positive but this week is negative", which is a mixed picture. Price above all three says every layer currently agrees.
How do you read price relative to the opens?
Work from the biggest period to the smallest.
- Where is price versus the monthly open? This is the broadest bias for the current month.
- Where is price versus the weekly open? This tells you what the week has done.
- Where is price versus the daily open? This is the most reactive and flips often.
- Count the agreement. Above all three is a clean picture of buyers in control. Below all three is the same for sellers. Mixed positions mean the layers disagree and the picture is unclear.
- Check how close price is. Price sitting right on an open is a decision point, not a trend. Wait to see which way it closes.
What does "cluster" mean?
Sometimes two opens, or an open and another level, sit almost on the same price. That is a cluster, and it carries extra attention: more reasons overlap in one small area, so a reaction there is more meaningful than at a lone line.
How do you use the opens in an if/then plan?
Opens are conditions, not predictions. Some patterns to write down before price arrives:
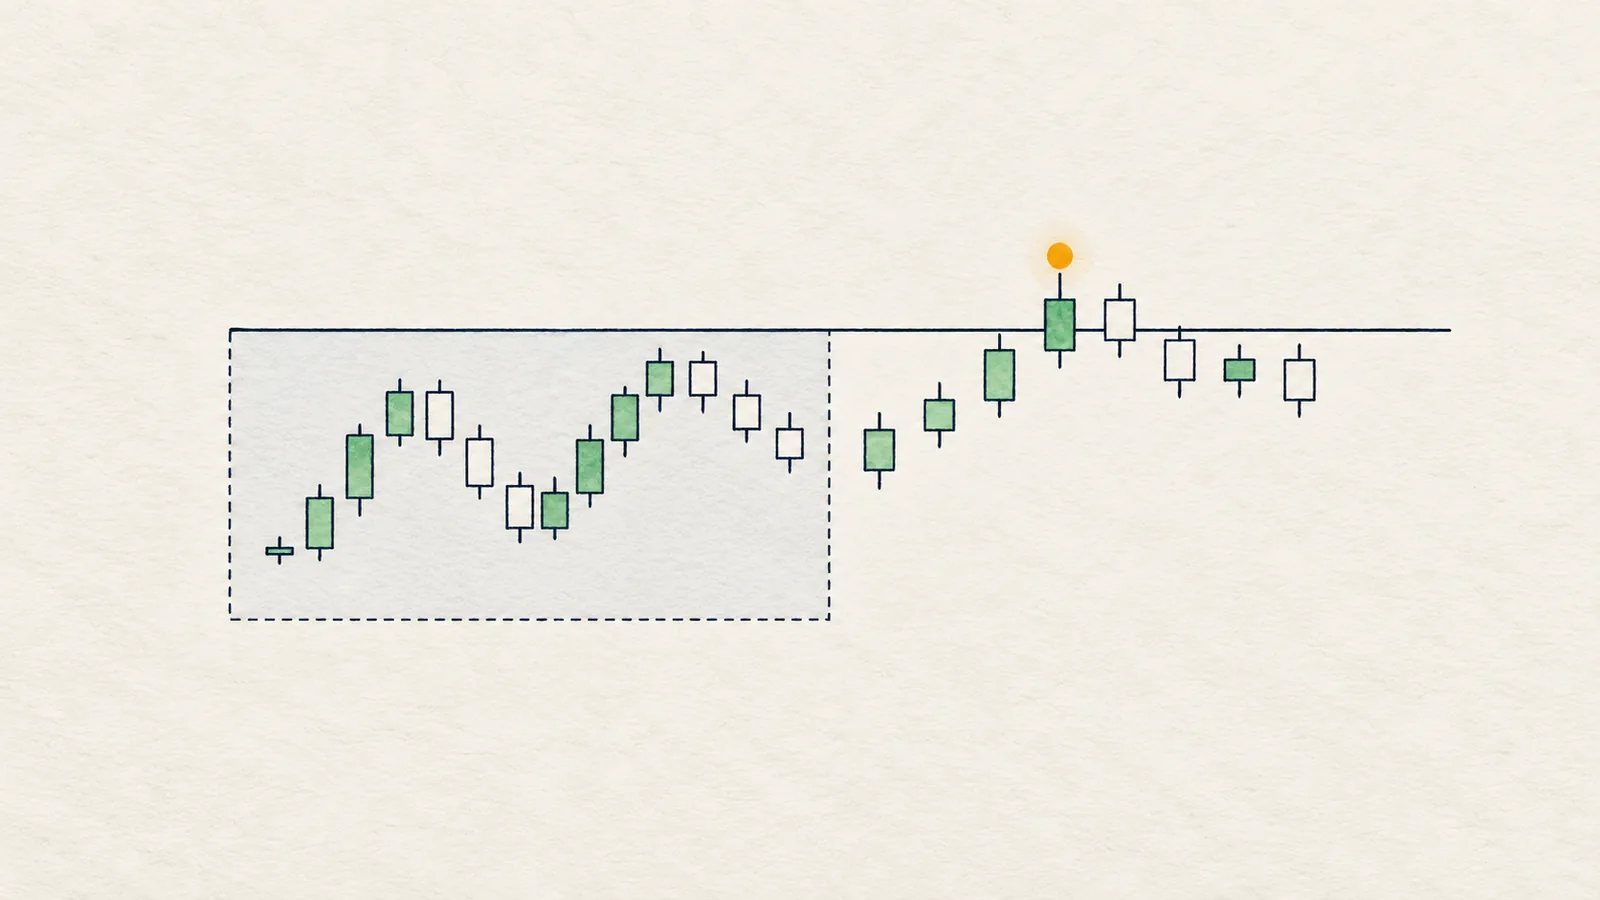
- Reclaim plan: "If price closes back above the weekly open, the week flips from sellers to buyers and the next reference is the level above. If it fails and closes under again, the reclaim failed."
- Rejection plan: "If price rises into the monthly open and a 4H candle closes back below it with a rejection wick, a move back down is the scenario. If a 4H candle closes above it, I stand aside or flip my view."
- Range plan: "Price is between the daily and the weekly open and has no direction. I wait for an edge."
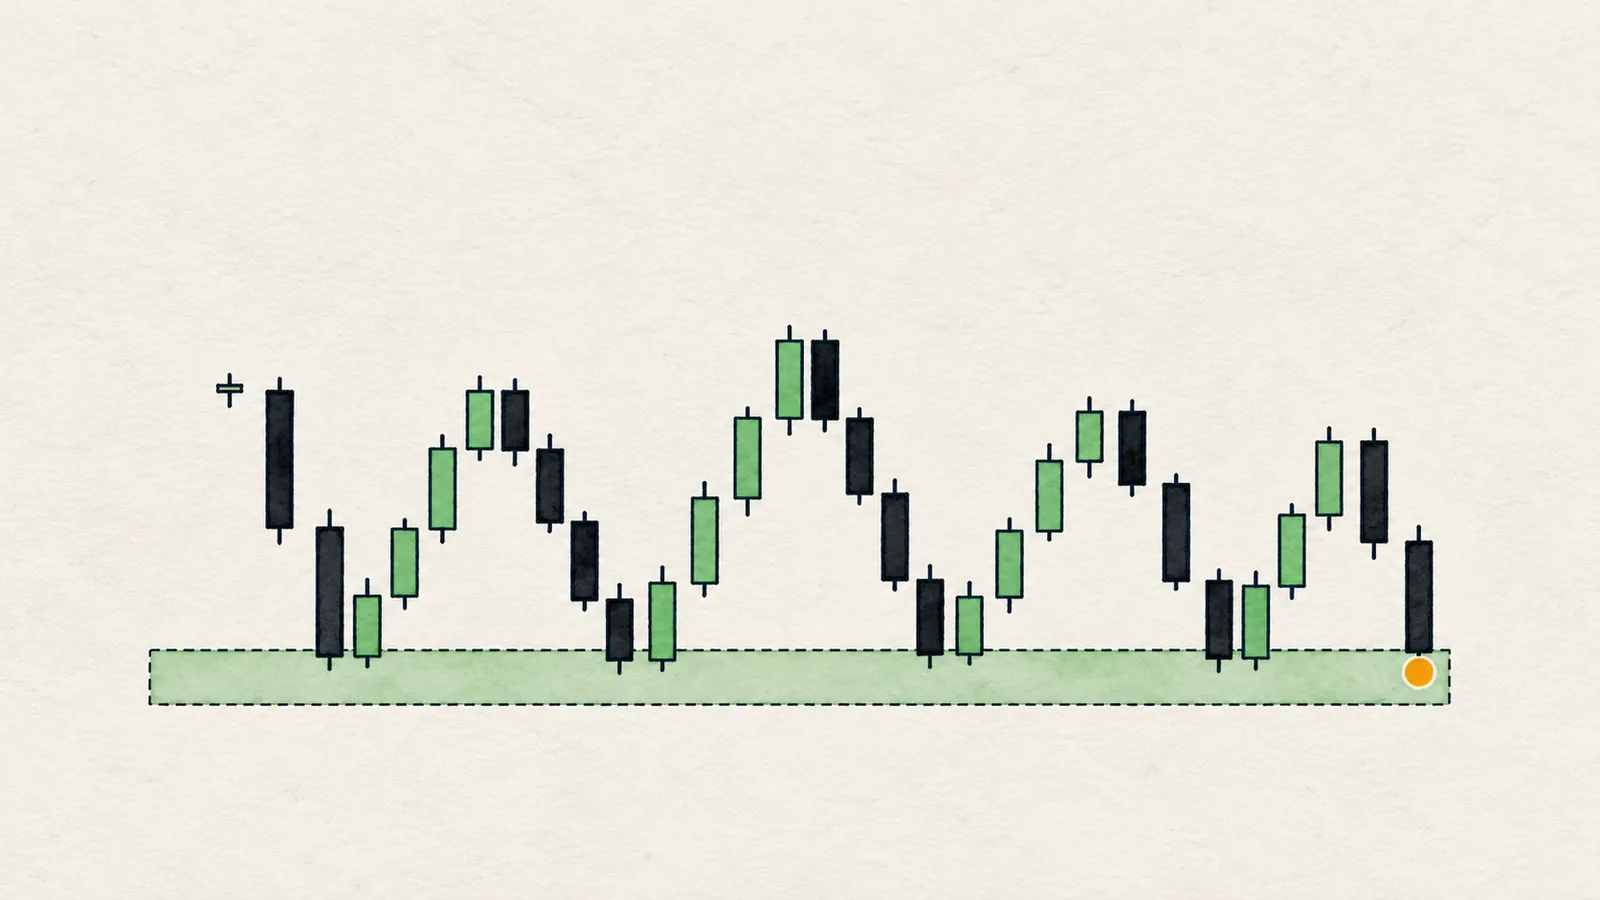
Pair the opens with something else. An open that matches a swing cluster, a prior-week low or an equal-highs pool is much better than a lone open. See support and resistance for how swing levels are built, and previous day and week highs and lows for the other period-based reference.
Check the higher timeframe too. A monthly open that lines up with the trend on larger charts is a stronger reference than one fighting it; multi-timeframe analysis shows how to combine them.
When do the opens mislead?
- As a magic line. An open is where a period began. Nothing forces price to react to it.
- When price chops around it. In a range, price crosses an open back and forth. Above and below lose meaning.
- Just after the roll. Right after a new period starts, price is near its open by definition, so "above" or "below" means very little. Give it a few candles.
- When time zones mix. A chart set to another zone can show you an open that is not the one everybody else is watching.
- On their own. Without structure, the opens only tell you about one period. Combine them with the trend.
In Chart Radars: the daily, weekly and monthly opens are measured in UTC, and because crypto trades 24/7, a new period opens at the last close of the previous one. They appear on the chart as DO, WO and MO, and the read tells you whether price is above or below each of them. When several candidates for a level sit within 0.25 ATR of each other, the chart keeps one name; the order is equal highs/lows first, then previous-week high/low, then the monthly open, then the weekly open, and the daily open comes after those.
Honest note: being above the weekly open does not make a market bullish. It means buyers have been ahead since Monday, and that can reverse in a single candle. Treat the opens as context for your plan, and let structure and your invalidation level do the real work.
What does it look like on a real chart?
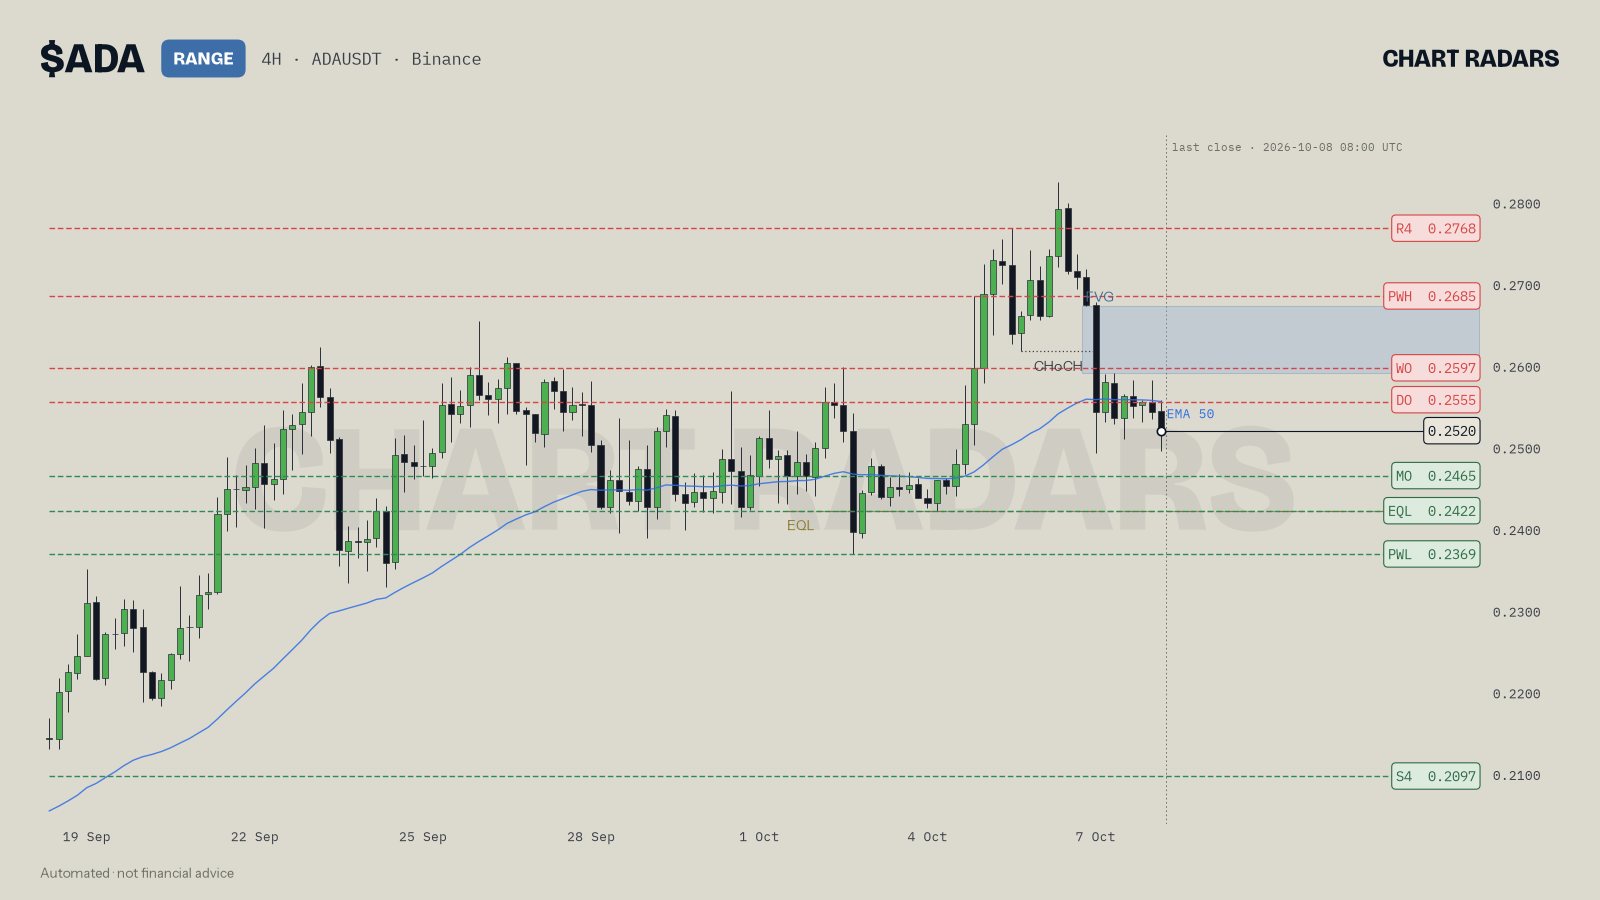
ADA 4H, close of 8 Oct 2026. Price is at 0.2520. The weekly open (WO) is at 0.2597 and the daily open (DO) at 0.2555, both above price, while the monthly open (MO) at 0.2465 is below it. The bot's read calls this "mixed": price is above the monthly open but below the weekly and daily opens. This is the layered picture in practice. The month is positive, the week and the day are negative so far, and the chart label reads RANGE. In the read, the 0.2465 monthly open appears as a first stop on a close below 0.2493.
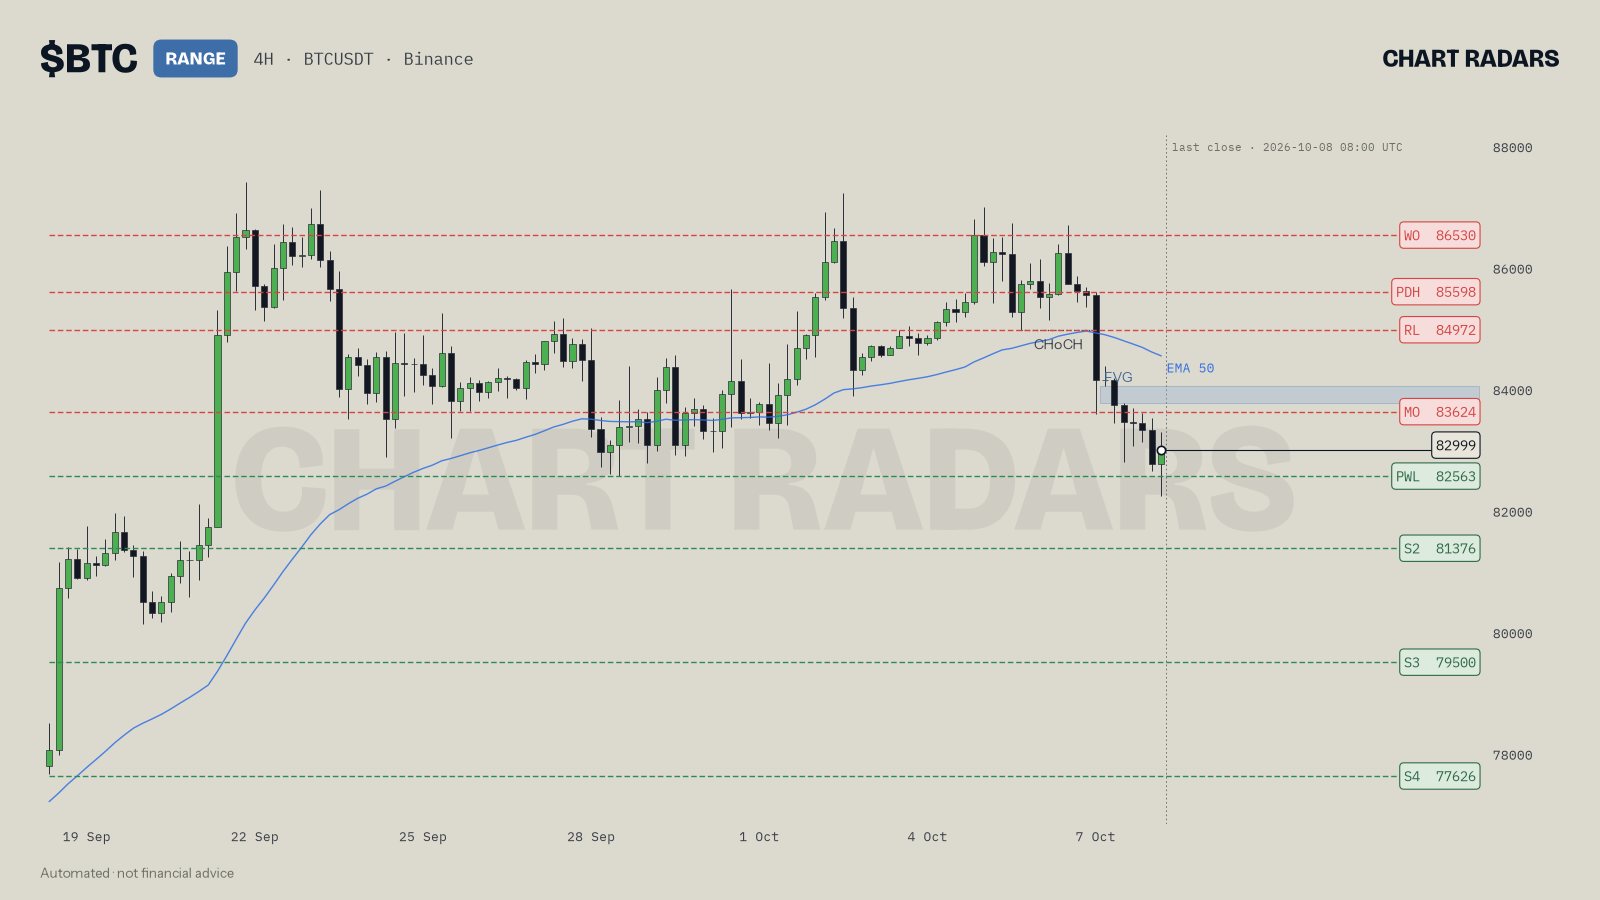
BTC 4H, close of 8 Oct 2026. Price is at 82999, below the monthly open at 83624, the daily open at 83322 and the weekly open at 86530. The read names the 83624 monthly open (tested 2 times) as the level a short would need to see rejected, and lists the 86530 weekly open as the last stop in the upside ladder if price closes above 83624. On the chart you can see the WO line well above price and the MO line just above it, so the opens set up the distance in both directions.
Key takeaways
- The opens are the first prices of a day, week and month, set on a fixed UTC clock because crypto never closes.
- Price above an open means buyers are ahead for that period; below means sellers are. It is context, not a forecast.
- Read from the monthly open down to the daily open, and check whether the layers agree.
- Use opens in if/then plans, ideally where they line up with swing levels or other references.
- Price sitting right on an open is a decision point, not a trend.
Frequently asked questions
What is the weekly open in crypto?
It is the price at which a new trading week begins. Because crypto trades 24/7, the weekly open is simply the price at the start of the week in a fixed time zone, usually UTC.
Why do traders watch the weekly open?
It shows who controls the week so far. Price above it means buyers are ahead for the week; below it, sellers are. Many traders also use it as a level to wait for reactions.
What time does the daily candle open in crypto?
On most exchanges and charts the daily candle opens at 00:00 UTC. If your chart is set to another time zone, the daily open will sit at a different clock time but the same moment.
Is price above the monthly open bullish?
It means buyers are ahead for the month so far, which is context and not a forecast. Price can sit above the monthly open and still fall back through it, so use it with structure.
Do opens work as support and resistance?
They often act as reference levels because many traders watch them, but there is no guarantee of a reaction. Treat them as places to watch and plan around, not as promises.