LTC technical analysis today
Daily (1D) read of Litecoin (LTC), built from closed candles only. Last update: .
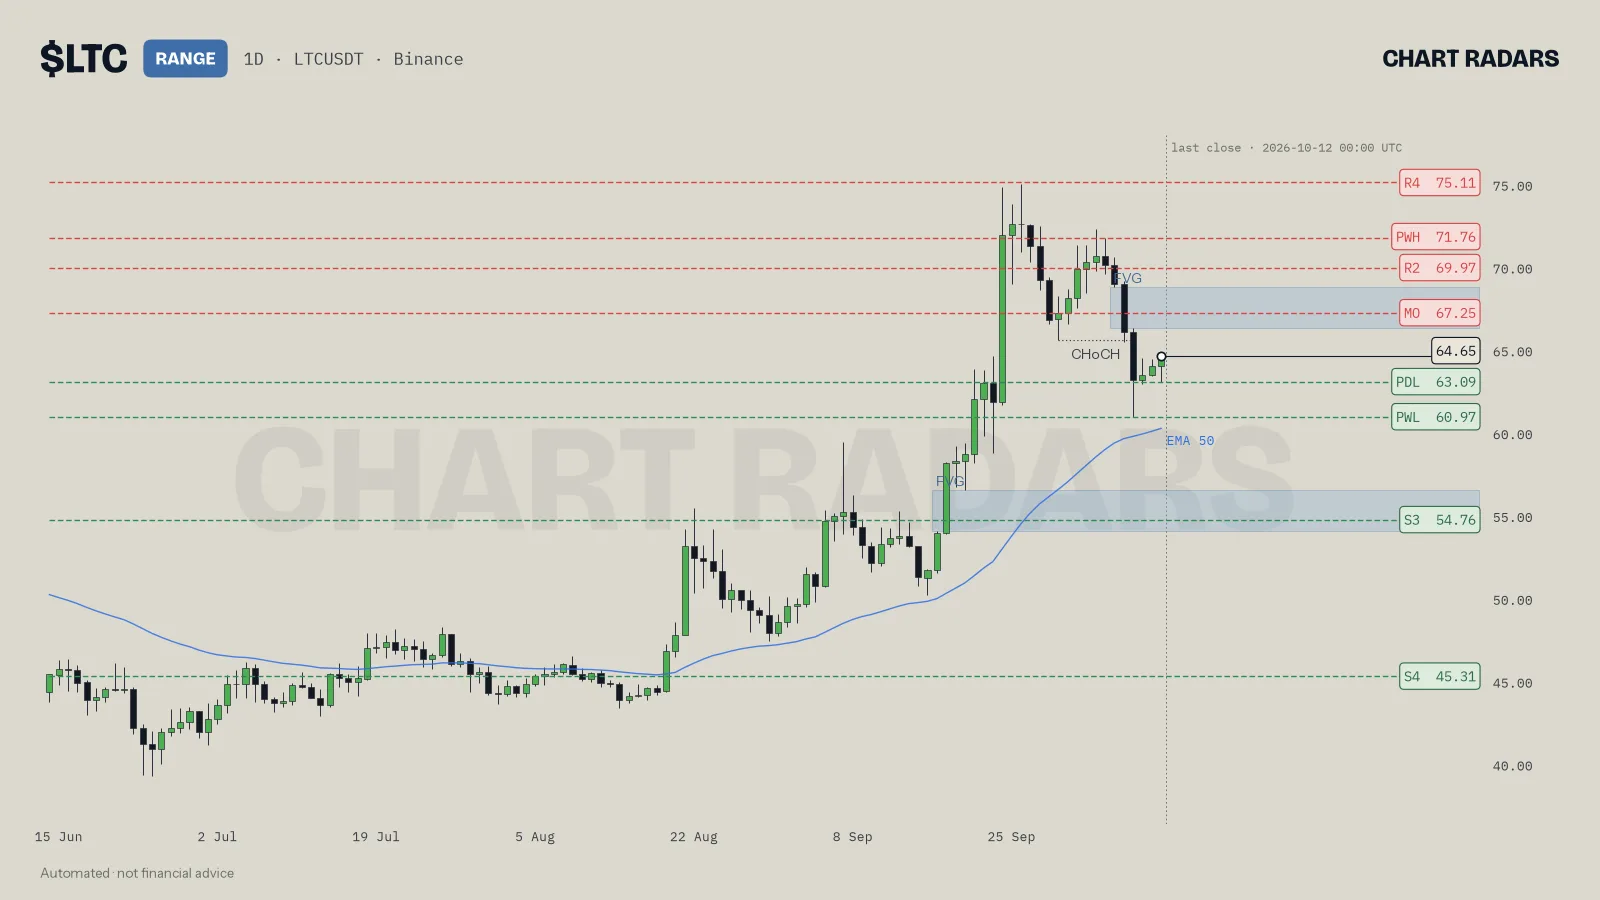
Trend: Sideways
A trend label needs three conditions to agree. This is what each one shows now:
- Swing structurelower highs and lower lowsbearish side
- Price vs the 50 EMAabove by 1.5 ATRbullish side
- Slope of the 50 EMA (last 10 candles)risingbullish side
The three conditions do not agree, so the 1D label is sideways: there is no clear trend on this timeframe.
Structure read by timeframe: 1D bearish · 1W bullish. Combined bias: neutral.
Snapshot
- Last 1D close
- 64.65
- RSI (14)
- 52 · neutral zone
- 50 EMA
- 60.27
- Volume vs 20-candle average
- 0.3×
Key levels
Levels the read is built on, nearest first. The last 1D close was 64.65.
Resistance above
- 67.25monthly open
- 69.97swing hightested 2 times
- 71.76prior-week hightested 2 times
- 75.11tested 3 times
Support below
- 63.09prior-day low
- 60.97prior-week lowtested 2 times
- 54.76tested 8 times
- 45.31tested 5 times
Two conditional scenarios
Each scenario starts with an if. Nothing here predicts which one happens.
Upside
If 1D closes above 67.25 (monthly open), the move up is confirmed and it opens the way to 69.97 (swing high) and 71.76 (prior-week high).
Downside
If 1D closes below 63.09 (prior-day low), the move down is confirmed and it opens the way to 60.97 (prior-week low) and 54.76 (tested 8 times).
Invalidation
A 1D close outside the 60.97 to 72.30 range ends the sideways read.
Derivatives context (perpetual futures)
Funding and open interest show how traders are positioned. They describe, they do not predict.
- Funding rate
- -0.0059% · per funding interval
- Open interest
- $76.0M (+2.8% in 24h)
- Taker buy/sell ratio
- 0.78×
- Long/short account ratio
- 1.91
What this means in plain language
Price is sitting right on its weekly and daily opens, a pivot cluster where the market has not picked a side. Price is trading below the monthly open at 67.25.
On the derivatives side, open interest is $76.0M (+2.8% in 24h), so new positions are being opened. Underneath that, funding -0.0059%, takers 0.78×, L/S 1.91.
Written by the bot from the fields above with fixed phrasing, the same way for every coin.
Learn how to read it
- Market structure: swings, HH/HL, LH/LL and trend vs range
- Support and resistance: how to draw levels that matter
- Multi timeframe analysis: reading 1W, 1D and 4H together
- Scenarios and invalidation: planning with if/then
- Where to place your invalidation level
- Funding rate: who pays whom and what it tells you
- Open interest: what it measures and how to read it with price
Frequently asked questions
How is the LTC trend decided?
The 1D label is bullish or bearish only when three things agree: swing structure (higher highs and higher lows, or lower highs and lower lows), price at least 0.3 ATR away from the 50 EMA on the same side, and the 50 EMA sloping the same way. If they disagree the label is sideways.
How often is this page updated?
Once a day, shortly after the daily candle closes (00:00 UTC). The time at the top shows the last update. A candle that is still forming is never used.
Is this investment advice?
No. The page describes chart conditions and what would change them, using public market data. It does not tell you what to do.